

Abstract
Hemolysis, a crucial feature of Sickle cell disease (SCD), is a key player for cellular activation leading to various complications including thrombosis. In response to hemolysis, platelets get activated and release components that are necessary for further platelet activation and aggregation. Thus, it is believed that platelets contribute to the development of thrombotic complications. Platelets in SCD are expected to be affected due to common cause of hemolysis. To measure the surface markers of platelets including P-Selectin, Phosphatidyl Serine and integrin αIIbβ3 in SCD patients and healthy controls in order to understand the status of the platelets in SCD. To measure the surface markers of activated platelets using flow cytometry. Since mitochondria and calcium play an important role in cellular functions, the mitochondrial membrane potential and calcium content of platelets in SCD were also evaluated using flow cytometry. In the present study, we have observed significant increase of calcium level in SCD platelets. Further, the loss of mitochondrial membrane potential in SCD platelets was found to be significantly higher when compared to platelets of healthy controls. Though the surface markers of activated platelets in SCD remain unchanged, increased level of calcium and mitochondrial membrane potential loss suggest that the platelets in SCD are more prone to become activated. In order to understand the status of the platelets in SCD, apart from the surface markers, it is also important to assess the calcium levels and mitochondrial membrane potential of platelets.
Keywords: Sickle cell disease, Platelet activation, Surface markers, Calcium content, Mitochondrial membrane potential
Introduction
Sickle cell disease (SCD) is an inherited blood cell disorder caused by a defect in beta chain of the haemoglobin leading to the formation of an abnormal haemoglobin, Haemoglobin S (HbS) within the red blood cells [1]. The pathophysiology of SCD involves a change in the amino acid from Glutamate to Valine that triggers polymerization of deoxy HbS within the RBCs. This results in the formation of sickling-shaped RBCs contributing to scraping of vascular endothelium and increased hemolysis [2, 3]. It is widely believed that the hemolysis causes cellular activation including platelets that contribute to thrombotic complications in SCD [4, 5]. Surface expressions of P-Selectin and αIIbβ3 are the important indicators of activated platelets. Unlike P-selectin, the αIIbβ3 is expressed as inactive state on the surface of both the resting and activated platelets and becomes activated in response to any trigger on platelets. Multiple studies, in the past, have reported increased platelet activation in SCD based on the expressions of surface markers such as P-selectin and integrin αIIbβ3 [5–7]. However, some studies have observed contradictory findings to the above with no significant activation of platelets in steady-state SCD [8, 9]. While vascular occlusion is associated with complications such as painful crisis, proliferative retinopathy, pulmonary infection, stroke and thrombosis [10], the role of activated platelets in such complications in SCD remains unclear.
Additionally, mitochondrial membrane is disrupted during the platelet activation and thus measurement of loss of mitochondrial membrane potential helps in identifying the status of the platelet activation. Previous studies have associated the depolarization of mitochondrial membrane with the severity and clinical outcome of the diseases like systemic inflammatory response syndrome, Preeclampsia, Sepsis, etc. [11–13]. These reports suggest the importance of measuring the mitochondrial membrane potential of platelets in various conditions. Also, since calcium is stored in different storage organelles of platelets and released in response to cellular changes like activation, calcium flux is also considered as an important marker of platelet activation [14–16]. In the earlier studies, increase of cytosolic calcium has been observed in activated platelets during agonist stimulated platelets [17, 18]. It is now understood that the elevation of calcium in platelets is essential for the platelet activation. Thus, in the current study, in order to understand the status of the platelets in steady-state SCD, we have studied the surface markers of activated platelets, mitochondrial membrane potential and calcium level of platelets from Sickle cell disease using flow cytometry.
Materials and Methods
Study Population and Sample Collection
A total of 10 sickle cell disease (SCD) patients, determined by haemoglobin electrophoresis, were included in this study. An equal number of healthy control subjects were also included in this study after confirming that they are free from illness and not under any medications for at least 14 days prior to the collection of blood sample. Of the 10 SCD patients, five were homozygous (HbSS) and four were heterozygous (HbSA) for sickled haemoglobin. The remaining one patient was compound heterozygous for sickle cell beta-thalassemia (HbSβ). The study procedures and/or protocols were reviewed and approved by the Human Ethics Committee of the All India Institute of Medical Sciences, New Delhi (EC No. 514). Both the patients and healthy controls provided their written informed consent to participate in the study.
Blood samples were collected in BD (Becton Dickinson and Company, USA) vacutainer tubes containing 3.2% Sodium citrate. Platelet rich plasma (PRP) was prepared by subjecting the tubes for centrifugation at 80 g for 10 min at room temperature.
Chemicals and reagents
Flow cytometer reagents such as anti-CD61/PE (Cat#555,754), anti-CD62P/APC (Cat#55,088), anti PAC-1 (Cat#340,507), Annexin V/FITC (Cat#556,547) and MitoScreen kit (Cat#551,302) were purchased from Becton Dickinson (San Diego, CA, USA); Annexin V/pacific blue (Cat#A35122) and Fluo-4 NW Calcium Assay Kit (Cat#F36206) were purchased from Molecular Probes (Willow Creek Road, Eugene, OR). The platelet activating agent, ADP was purchased from Bio/Data Corporation (Horsham, PA, USA) and calcium ionophore A23187 (Cat#C7522) was purchased from Sigma-Aldrich (St. Louis, MO). All other chemicals used were of molecular biology grade.
Measurement of surface markers of activated platelets
Flow cytometry based experiments were carried out to measure the surface markers of activated platelets in SCD patients and healthy controls following the previously established protocol [19]. The whole blood samples were incubated with CD61, CD62P and PAC-1 antibodies to measure the P-Selectin and integrin αIIbβ3 on the surface of the platelets. The sample processing and the analysis were followed using our previously established protocol [20]. In brief, 100 µl of whole blood containing ~ 1.5 × 10⁶ platelets was mixed with equal volume of 1X Phosphate buffer saline (PBS) in 1% bovine serum albumin (BSA) with all the three antibodies mentioned above. Further to the incubation, the cells were fixed with 1% paraformaldehyde in PBS and immediately processed FACScanto II flow cytometer (Becton Dickinson, San Diego, CA, USA). In order to measure the maximal activation of platelets, ADP was used to stimulate the platelets in a separate tube before staining with antibodies. Platelets were distinguished from other blood cells based on the forward light scatter (FSC) and side light scatter (SSC) on a log/log scale. The percentages of CD62P and PAC-1 positive platelets were calculated relative to the total number of CD61-positive platelets present in each sample (Fig. 1A, B).
Fig. 1.

Measurement of surface expressions of platelet activation markers. A Annexin V binding to PS on the platelets of both healthy control and SCD (Top: Untreated platelets; Bottom: Calcium Ionophore-treated platelets). B CD62P binding to P-Selecting on the platelets of both healthy control and SCD (Top: Untreated platelets; Bottom: ADP-treated platelets). C PAC-1 binding to αIIbβ3 on the platelets of both healthy control and SCD (Top: Untreated platelets; Bottom: ADP-treated platelets). [SCD: Sickle cell disease, PS: phosphatidylserine and ADP: Adenosine diphosphate]
For the measurement of PS externalization on the surface of the platelets, Annexin V was treated with platelet rich plasma (PRP). Approximately, 1.5 × 10⁶ platelets were stained with CD61 and Annexin V and subjected for incubation in dark. The samples were then processed using FACScanto II flow cytometer (Becton Dickinson, San Diego, CA, USA). Similar to the above, prior to the acquisition of samples, the platelets were fixed with 1% cold paraformaldehyde in PBS. In order to expose the high PS on the surface and to measure the maximal activation of platelets, calcium ionophore was used. (Fig. 1C).
Determination of mitochondrial membrane potential by JC-1 assay
The measurement of mitochondrial membrane potential (⧍Ψm) was performed following the manufacturer’s instructions and also by following a published literature (11). Briefly, ~ 1.5 × 10⁶ platelets were incubated with 1X assay buffer containing JC-1 dye (5,5',6,6'-tetrachloro-1,1',3,3' tetraethylbenzimidazolcarbocyanine iodide) at 37 °C in dark for 15 min. In order to induce the ⧍Ψm loss, that served as a positive control, the platelets were treated with 100 µM Carbonyl cyanide 3-chlorophenylhydrazone (CCCP). Further to the incubation, the samples were subjected for the flow cytometry analysis using FACScanto II flow cytometer (Becton Dickinson, San Diego, CA, USA) (Fig. 2). JC-1 exhibits in two forms as monomers and aggregates in a concentration-dependent manner in mitochondria. Being a cationic dye, in normal platelets, the JC-1 enters the mitochondria where it accumulates to form aggregates. In case of activated platelets, the dye enters the mitochondria to a lesser degree due to depolarized ⧍Ψm and subsequent loss of electrochemical gradient within the mitochondria. Thus the monomers accommodate low concentrations of dye whereas the aggregates accommodate high concentrations of the dye. Since the depolarization of ⧍Ψm is associated with altered platelet function and pathological conditions, it serves as an indicator of potential for platelet activation.
Fig. 2.
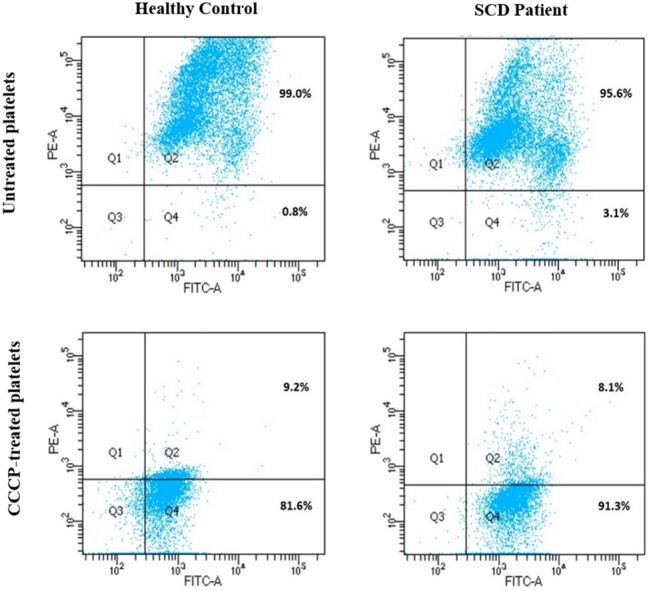
Measurement of mitochondrial membrane potential (ΔΨm) loss. Measurement of ΔΨm loss of platelets in both healthy control and SCD. In the above image, the Q4 indicates the amount of depolarization of ΔΨm (Top: Untreated platelets; Bottom: CCCP-treated platelets). [SCD: Sickle cell disease and CCCP: Carbonyl cyanide 3-chlorophenylhydrazone]
Measurement of intracellular calcium
Intracellular calcium of platelets was measured using the Fluo-4 NW calcium assay kit (Invitrogen, UK) following the manufacturer’s instructions. Briefly, ~ 1 × 10⁶ platelets were mixed with 1X dye [Fluo-4 NW dye mix in 1X assay buffer (1X HBSS, 20 mM HEPES)] containing 2.5 mM probenecid at 37 °C in dark for 30 min followed by incubation at RT for 30 min. Following which, the samples were analysed using flow cytometer to detect the FITC signal. To measure the intracellular calcium, cells were initially assessed for 30 s to establish a baseline (pre-stimulation) FITC signal. Following which, in order to release the organelle-stored calcium into cytosol, the cells were treated with 0.1 µM Calcium ionophore. Further, cells were analysed up to 240 s to determine the post-stimulation FITC signal. The median pre- and post-stimulation FITC signal values were determined using FlowJo v10 software to evaluate the calcium content of platelets (Fig. 3).
Fig. 3.

Intracellular calcium of platelets as measured by relative median FITC signal. In the image, A indicates the granular content of baseline calcium in untreated platelets, measured for the duration of 1 to 25 s; B indicates the release of calcium into cytoplasm in calcium ionophore-treated platelets, measured for the duration of 180 to 205 s
Statistical analyses
Data were evaluated for normal distribution by Shapiro–Wilk statistic and variance by Brown-Forsythe statistic methods. The statistical significance of the differences between groups were determined with 2-tailed parametric t-test (p) and non-parametric Mann–Whitney U-test (p*) using GraphPad Prism, Version 9.3.1 (GraphPad Software, San Diego, CA). P values < 0.05 and < 0.005 were marked as ∗ and ∗ ∗ respectively.
Results
Patient Characteristics
Hemolysis in Sickle cell disease leads to cellular activation that results in various complications including thrombosis. Platelets are triggered in response to hemolysis and release components that are necessary for further activation and aggregation. Since the platelets are the major players of thrombosis, we aimed to understand the status of the platelets in steady-state SCD. We have measured the markers of the activated platelets such as P-Selectin, integrin αIIbβ3 and Phosphatidylserine using flow cytometry in all the patients and healthy controls enrolled in this study. Of the 10 patients with SCD, 7 were males and 3 were females with a median age of 25. Age and sex-matched healthy individuals were served as controls for this study.
Similar expressions of surface markers of activated platelets in SCD and control
To measure the surface markers of activated platelets, CD61-positive platelets were selected based on the FSC and SSC parameters. The surface markers of activated platelets such as P-Selectin, integrin αIIbβ3 and PS were evaluated by measuring the bindings of corresponding antibodies (CD62P, PAC-1 and Annexin V respectively) on the surface of the platelets. The average expression of P-Selectin on SCD platelets was 3.579% ± 0.62% compared to 3.929% ± 0.39% on healthy controls. The surface expression of integrin receptor αIIbβ3, as measured by PAC-1 binding, was 0.343% ± 0.06% in SCD compared to 0.219% ± 0.02% on control platelets. The PS exposure on SCD platelets as measured by Annexin V binding on platelets was 0.594% ± 0.13%. The control platelets exhibited similar results for the Annexin V binding which is 0.526% ± 0.03%.
Significant loss of mitochondrial membrane potential in SCD platelets
Mitochondria play an important role during cellular activation as changes in the electrochemical gradient impacts the mitochondrial membrane potential (⧍Ψm). Compared to the healthy platelets, mitochondria of activated platelets exhibit depolarization of ⧍Ψm. The changes in the ⧍Ψm can be assessed by JC-1 assay, a method that is widely used to assess the mitochondrial health. The flow cytometry based JC-1 assay was performed on both the patients and healthy individuals. The platelets of SCD had ⧍Ψm of 3.563% ± 0.93% which is significantly depolarised than that of normal platelets (1.228% ± 0.33%). The platelets treated with CCCP, a positive control, exhibited maximum loss of mitochondrial membrane potential in both the patients and healthy controls.
Higher level of intracellular calcium in SCD platelets
Since calcium plays very important role in cellular activation pathways, the intracellular calcium was measured in SCD platelets. Calcium is a key regulator of platelet function and increased level of intracellular calcium is an indicator of altered cellular function. The FITC signal, an indicator of calcium concentration, within the cells of SCD was found to be 554.8 ± 43.81, which is higher compared to that of platelets from healthy individuals which is 418.9 ± 19.76. Calcium Ionophore-stimulated platelets were served as a positive control for this experiment. Further to the stimulation with Calcium Ionophore, the FITC signal exhibited 6268 ± 514.7 in SCD platelets vs.5253 ± 253.8 in healthy platelets. The calcium assay suggested the presence of higher intracellular calcium in SCD.
Discussion
Platelets, in general, undergo activation in response to various stress including pathologic conditions. There are evidences that platelets get activated in Sickle cell disease (SCD) [21, 22]. Thus, activated platelets contribute to complications such as risk of thrombosis in SCD [23]. However, some studies have found no activation platelets in SCD [8, 9]. Irrespective of the research findings, clinically it is evident that the individuals with SCD experience thrombotic complications [24, 25]. It is well known that the platelets are the primary contributors of thrombosis, however, it is unclear about the role of platelets to such a clinical complication in SCD. In our current study, we have assessed the status of the platelets in SCD patients using flow cytometry studies to measure the surface markers of activated platelets, mitochondrial membrane potential and calcium content. Flow cytometry analysis suggested no significant differences between the patients and control for the surface markers of activated platelets. The surface expression of P-Selectin on SCD platelets was compared to that of healthy individuals (3.5% in SCD vs 3.9% in Control; p = 0.641). Other surface markers such as integrin αIIbβ3 and PS exposure, though statistically not significant, displayed little higher expressions on SCD platelets compared to control platelets [0.34% in SCD vs 0.22% in control; (p = 0.098) for integrin αIIbβ3 & 0.59% in SCD vs 0.52% in control; (p = 0.565) for PS exposure] (Fig. 4). Such results suggest no significant alteration on the surface of the platelets in SCD during physiological stress. The previous reports support our current findings where no significant association was observed between the surface markers of activated platelets and the SCD [8, 9, 21]. These markers are expected to be significantly higher when the platelets undergo a complete activation and apoptosis. Our first set of experiments suggested that SCD platelets did not undergo full activation or apoptosis.
Fig. 4.

Analysis of surface expressions of platelet activation markers. Surface expressions of (A) PS using Annexin V (B) P-Selectin using CD62P and (C) αIIbβ3 using PAC-1 on platelets of both SCD and controls. (Line with bars in scatter dot plot indicates Mean ± SEM). [SCD: Sickle cell disease, PS: phosphatidylserine, SEM: Standard Error of Mean, ns = non-significant)
Our second set of experiments aimed to study the platelet granules and mitochondria as they play important roles in the cellular function by means of immediate response to any triggers. Importantly, recent evidences suggest that mitochondria are crucial for various cellular mechanisms of platelets [26, 27]. The formation of mitochondrial permeability transition pore (MPTP) is a critical factor in the regulation of platelet activation [28, 29]. In our current study, the ⧍Ψm loss in SCD was significantly altered when compared to healthy individuals (p = 0.0372) which indicates that the platelets of SCD are susceptible for platelet activation (Fig. 5A). Our observation is supported by a previous study in which MPTP was reported to be lost in SCD patients [30].
Fig. 5.

Analysis of mitochondrial membrane potential and intracellular calcium of platelets. A: Loss of mitochondrial membrane potential in SCD platelets compared to healthy platelets. B: Increased intracellular calcium in SCD platelets as measured by FITC signal [SCD: Sickle cell disease, ΔΨm: Mitochondrial membrane potential, FITC: Fluorescein isothiocyanate, *: p < 0.05 and **: p < 0.005].
The dense granules are the storage organelles for the calcium ions which control cellular functions from short-term responses such as secretion or aggregation to long-term events such as cell survival [15]. In order to test the calcium content of the platelets in SCD, Fluo-4 NW calcium assay was performed on flow cytometry. Our study clearly indicated an increased amount of cellular calcium in SCD platelets when compared to control platelets (554.8 ± 43.81 vs. 418.90 ± 19.76; p = 0.003) (Fig. 5B). This significant increase of calcium content in the SCD platelets positively correlate with the ⧍Ψm loss. To our knowledge, this is the first attempt to identify the cellular calcium of platelets in sickle cell disease.
To conclude, our study indicates that SCD platelets undergo significant alterations in terms of cellular calcium level and mitochondrial transmembrane potential which may further enhance platelet activation and apoptosis through signalling mechanisms. Though the surface markers of activated platelets remain unchanged, the calcium level and mitochondrial membrane potential were significantly altered in SCD platelets, suggesting the potential for platelet activation. Therefore, to understand the status of the platelets in SCD, apart from the surface markers, it is also important to assess the calcium levels and mitochondrial membrane potential which would indicate the risk of occurrence of activated platelets in SCD. Identifying the nature of platelets (activation potential) in SCD is very important to prevent the thrombotic and other complications in these patients.
Acknowledgements
The authors thank the funding agency, Science and Engineering Research Board, Department of Science and Technology (DST-SERB), Government of India, INDIA (Grant ID: EMR/2016/000955) for supporting this study. The authors also thank the participants who volunteered for this study.
Authors’ contributions
SM, CLR and KK collected samples, performed experiments and collected data. RR helped with the sample collection and clinical data collection. FA critically revised the manuscript for important intellectual content. RS and MM supported the clinical data, interpreted and validated the manuscript. MK designed the study, supervised the project, interpreted the data and wrote the manuscript. All authors have approved the final article.
Declarations
Conflict of interest
The authors have no conflicts of interests.
Ethical approval
This study was approved by the institutional human ethics committee (IEC-514). All procedures followed were in accordance with the ethical standards of the institutional committee on human experimentation and with the Helsinki Declaration of 1975, as revised in 2008 (5). All persons gave their informed consent prior to their inclusion in the study. Informed consent was obtained from all patients for being included in the study.
Consent to participate
Informed consent had been taken from the participants of this study.
Consent for publication
Consent for publication had been taken from all the contributing authors.
Footnotes
Publisher's Note
Springer Nature remains neutral with regard to jurisdictional claims in published maps and institutional affiliations.
References
- 1.Quinn CT. Minireview: clinical severity in sickle cell disease: the challenges of definition and prognostication. Exp Biol Med. 2016;241(7):679–688. doi: 10.1177/1535370216640385. [DOI] [PMC free article] [PubMed] [Google Scholar]
- 2.Kavanagh PL, Fasipe TA, Wun T. Sickle cell disease: a review. JAMA. 2022;328(1):57–68. doi: 10.1001/jama.2022.10233. [DOI] [PubMed] [Google Scholar]
- 3.Rees DC, Williams TN, Gladwin MT. Sickle-cell disease. Lancet (London, England) 2010;376(9757):2018–2031. doi: 10.1016/S0140-6736(10)61029-X. [DOI] [PubMed] [Google Scholar]
- 4.Annarapu GK, Nolfi-Donegan D, Reynolds, , et al. Mitochondrial reactive oxygen species scavenging attenuates thrombus formation in a murine model of sickle cell disease. JTH. 2021;19(9):2256–2262. doi: 10.1111/jth.15298. [DOI] [PubMed] [Google Scholar]
- 5.Villagra J, Shiva S, Hunter LA, et al. Platelet activation in patients with sickle disease, hemolysis-associated pulmonary hypertension, and nitric oxide scavenging by cell-free hemoglobin. Blood. 2007;110(6):2166–2172. doi: 10.1182/blood-2006-12-061697. [DOI] [PMC free article] [PubMed] [Google Scholar]
- 6.Wun T, Paglieroni T, Rangaswami A, et al. Platelet activation in patients with sickle cell disease. Br J Haematol. 1998;100(4):741–749. doi: 10.1046/j.1365-2141.1998.00627.x. [DOI] [PubMed] [Google Scholar]
- 7.Vogel S, Thein SL. Platelets at the crossroads of thrombosis, inflammation and haemolysis. Br J Haematol. 2018;180(5):761–767. doi: 10.1111/bjh.15117. [DOI] [PMC free article] [PubMed] [Google Scholar]
- 8.Frelinger AL, 3rd, Jakubowski JA, Brooks JK, et al. Platelet activation and inhibition in sickle cell disease (pains) study. Platelets. 2014;25(1):27–35. doi: 10.3109/09537104.2013.770136. [DOI] [PubMed] [Google Scholar]
- 9.Osman Y, Vatte CB. Study of platelet activation markers and plasma cytokines in sickle cell disease patients during vaso-occlusive pain crises. J Hematopathol. 2018;11:37–44. doi: 10.1007/s12308-018-0322-6. [DOI] [Google Scholar]
- 10.Thein MS, Igbineweka NE, Thein SL. Sickle cell disease in the older adult. Pathology. 2017;49(1):1–9. doi: 10.1016/j.pathol.2016.10.002. [DOI] [PMC free article] [PubMed] [Google Scholar]
- 11.Yamakawa K, Ogura H, Koh T, et al. Platelet mitochondrial membrane potential correlates with severity in patients with systemic inflammatory response syndrome. J Trauma Acute Care Surg. 2013;74(2):411–418. doi: 10.1097/TA.0b013e31827a34cf. [DOI] [PubMed] [Google Scholar]
- 12.Kraemer BF, Hennis I, Karge A, et al. Platelet mitochondrial membrane depolarization reflects disease severity in patients with preeclampsia. Mol Med (Camb, MA) 2022;28(1):51. doi: 10.1186/s10020-022-00472-x. [DOI] [PMC free article] [PubMed] [Google Scholar]
- 13.Gründler K, Angstwurm M, Hilge R, et al. Platelet mitochondrial membrane depolarization reflects disease severity in patients with sepsis and correlates with clinical outcome. Crit Care (Lond, Engl) 2014;18(1):R31. doi: 10.1186/cc13724. [DOI] [PMC free article] [PubMed] [Google Scholar]
- 14.Kaiser R, Escaig R, Kranich J, et al. Procoagulant platelet sentinels prevent inflammatory bleeding through GPIIBIIIA and PVI. Blood. 2022;140(2):121–139. doi: 10.1182/blood.2021014914. [DOI] [PMC free article] [PubMed] [Google Scholar]
- 15.Jardín I, López JJ, Pariente JA, et al. Intracellular calcium release from human platelets: different messengers for multiple stores. Trends Cardiovasc Med. 2008;18(2):57–61. doi: 10.1016/j.tcm.2007.12.004. [DOI] [PubMed] [Google Scholar]
- 16.Kannan M, Ahmad F, Saxena R. Platelet activation markers in evaluation of thrombotic risk factors in various clinical settings. Blood reviews. 2019;37:100583. doi: 10.1016/j.blre.2019.05.007. [DOI] [PubMed] [Google Scholar]
- 17.Brass LF, Shattil SJ. Identification and function of the high affinity binding sites for Ca2+ on the surface of platelets. J Clin Investig. 1984;73(3):626–632. doi: 10.1172/JCI111252. [DOI] [PMC free article] [PubMed] [Google Scholar]
- 18.Varga-Szabo D, Braun A, Nieswandt B. Calcium signaling in platelets. J Thromb Haemost. 2009;7(7):1057–1066. doi: 10.1111/j.1538-7836.2009.03455.x. [DOI] [PubMed] [Google Scholar]
- 19.Kannan M, Ahmad F, Yadav BK, et al. Carrier detection in Glanzmann thrombasthenia: comparison of flow cytometry and Western blot with respect to DNA mutation. Am J Clin Pathol. 2008;130(1):93–98. doi: 10.1309/HYE4AP9961CEP0C0. [DOI] [PubMed] [Google Scholar]
- 20.Kannan M, Ahmad F, Yadav BK, et al. Molecular defects in ITGA2B and ITGB3 genes in patients with Glanzmann thrombasthenia. JTH. 2009;7(11):1878–1885. doi: 10.1111/j.1538-7836.2009.03579.x. [DOI] [PubMed] [Google Scholar]
- 21.Jakubowski JA, Zhou C, Winters KJ, et al. The effect of prasugrel on ADP-stimulated markers of platelet activation in patients with sickle cell disease. Platelets. 2015;26(5):474–479. doi: 10.3109/09537104.2014.940887. [DOI] [PubMed] [Google Scholar]
- 22.Berney SI, Ridler CD, Stephens AD, et al. Enhanced platelet reactivity and hypercoagulability in the steady state of sickle cell anaemia. Am J Hematol. 1992;40(4):290–294. doi: 10.1002/ajh.2830400409. [DOI] [PubMed] [Google Scholar]
- 23.Tomer A, Harker LA, Kasey S, et al. Thrombogenesis in sickle cell disease. J Lab Clin Med. 2001;137(6):398–407. doi: 10.1067/mlc.2001.115450. [DOI] [PubMed] [Google Scholar]
- 24.Brunson A, Keegan T, Mahajan A, et al. High incidence of venous thromboembolism recurrence in patients with sickle cell disease. Am J Hematol. 2019;94(8):862–870. doi: 10.1002/ajh.25508. [DOI] [PMC free article] [PubMed] [Google Scholar]
- 25.Naik RP, Streiff MB, Haywood C, et al. Venous thromboembolism incidence in the cooperative study of sickle cell disease. JTH. 2014;12(12):2010–2016. doi: 10.1111/jth.12744. [DOI] [PMC free article] [PubMed] [Google Scholar]
- 26.Jedlička J, Kunc R, Kuncová J (2021) Mitochondrial respiration of human platelets in young adult and advanced age - Seahorse or O2k? Physiol Res 10.33549/physiolres.934812 [DOI] [PMC free article] [PubMed]
- 27.Palacka P, Gvozdjáková A, Rausová Z, et al. Platelet mitochondrial bioenergetics reprogramming in patients with urothelial carcinoma. Int J Mol Sci. 2021;23(1):388. doi: 10.3390/ijms23010388. [DOI] [PMC free article] [PubMed] [Google Scholar]
- 28.Wang Z, Cai F, Hu L, et al. The role of mitochondrial permeability transition pore in regulating the shedding of the platelet GPIbα. Ectodomain. Platelets. 2014;25(5):373–381. doi: 10.3109/09537104.2013.821604. [DOI] [PubMed] [Google Scholar]
- 29.Jobe SM, Wilson KM, Leo L, et al. Critical role for the mitochondrial permeability transition pore and cyclophilin D in platelet activation and thrombosis. Blood. 2008;111(3):1257–1265. doi: 10.1182/blood-2007-05-092684. [DOI] [PMC free article] [PubMed] [Google Scholar]
- 30.Cardenes N, Corey C, Geary L, et al. Platelet bioenergetic screen in sickle cell patients reveals mitochondrial complex V inhibition, which contributes to platelet activation. Blood. 2014;123(18):2864–2872. doi: 10.1182/blood-2013-09-529420. [DOI] [PMC free article] [PubMed] [Google Scholar]