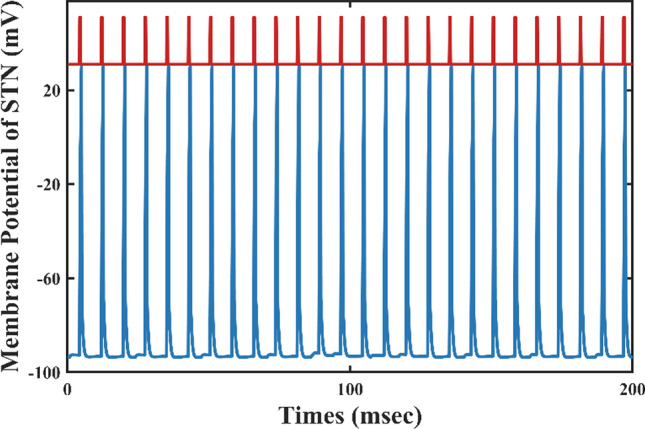
Fig. 14.

Time evolutions of membrane voltages (mV) for a single STN neuron with DBS added directly to the STN. The red curve represents a pulse of deep brain stimulation, and the blue curve shows a single STN neuronal membrane potential time series. As can be seen in the figure, each spike of STN corresponds to a DBS pulse
