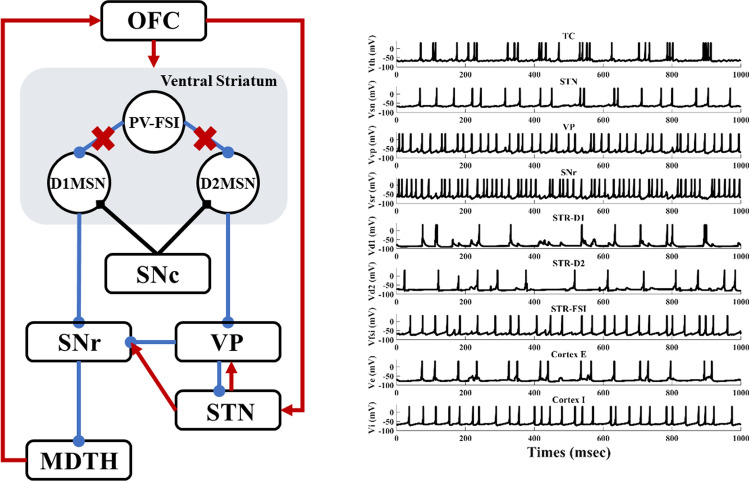
Fig. 9.
Schematic diagram of the altered structure and time evolutions of membrane voltages (mV) for individual network neurons in loss connectivity from PV-FSIs to MSNs states (decreasing the synaptic conductance of the FSI-MSN by 50%). In this condition, neurons in the striatum show a high-frequency discharge. TC, STN and Cortex E neurons represent burst patterns. Red cross indicates reduced connections

