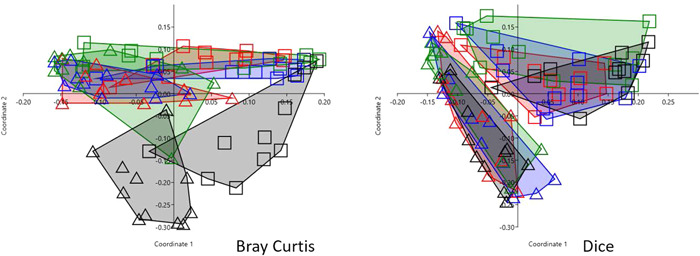
Figure 3.

PCoA with 44 milk samples processed and sequenced twice, type 1 replicates. Samples are grouped by individual (color) and sequencing run (symbol). The similarity index used is indicated in the figure. For three out of four individuals, there were significant differences between runs, when analyzed in ANOSIM, for both similarity indexes used.
