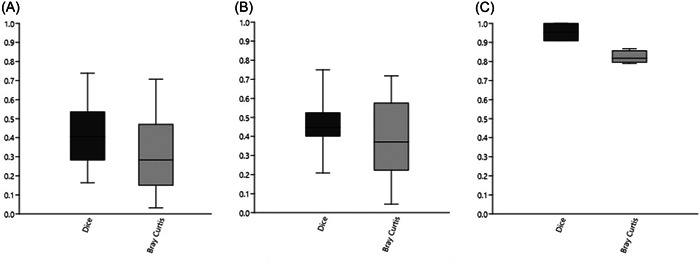
Figure 4.

Boxplots of direct comparison of similarity in type 1 and type 2 replicates using different similarity indexes. (A) Type 1 replicates of milk samples sequenced in two different runs (n = 44). (B) Type 2 replicates of milk samples (taken 1–2 h apart) sequenced within the same run (n = 32). (C) Type 1 replicates of a bacterial mock community sequenced in two different runs (n = 4). For boxes, the 25%–75% quartiles are in the box, and max and min are shown as whiskers.
