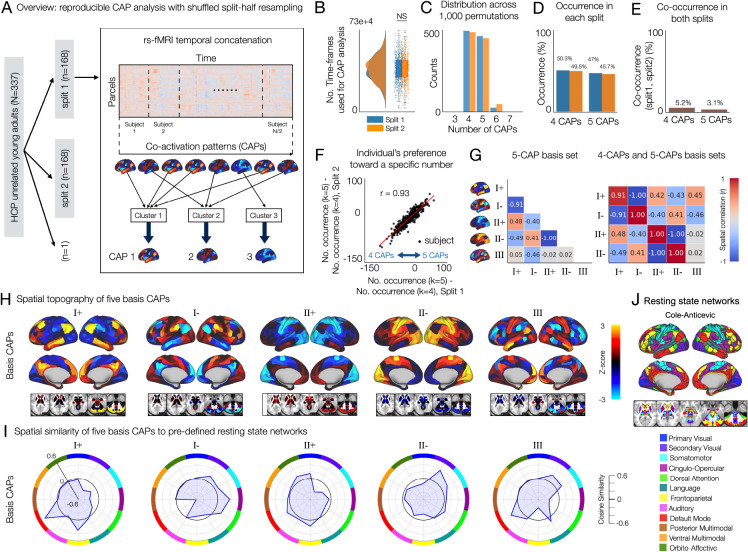
Fig. 1. A reproducible set of co-activation patterns (CAPs) in the whole-brain rs-fMRI involve recurring mixed representations of canonical resting state networks.
(A) Analysis overview. In each permutation, 337 subjects are randomly split into two equal-sized groups. Within each split, a parcel-by-time array of rs-fMRI data are temporally concatenated across subjects. Time-frames are clustered based on spatial similarity using K-means clustering. The number of clusters (k) is estimated for each split. Each CAP is obtained as the centroid of each cluster (Supplementary Fig. S1). (B) The number of time-frames used for analysis are not different between two splits (two-sided paired t-test). (C) The estimated number of CAPs (k) in each split across 1,000 permutations. (D) Occurrence rate (%) of k = 4 or k = 5 solutions in each split. (E) Co-occurrence rate (%) of k = 4 or k = 5 solutions in both splits. (F) Individual’s statistical preference toward a specific number of CAPs (k) is reproducible. In each split, individual’s preference toward a specific number was quantified using the number of permutations that resulted in a specific solution (eg. 4 CAPs or 5 CAPs) across 1,000 permutations. Specifically, we compute the difference (occurrence of k = 5) – (occurrence of k = 4) for each subject (Methods). (G) Spatial correlation of the 5-CAP basis set (left) and between the 4-CAP basis set and the 5-CAP basis set (right). r values were rounded to the nearest 2 decimal digits. (H) Spatial topography of 5 basis CAPs. (I) Spatial similarity of the 5 basis CAPs to canonical resting state networks, pre-defined using the CAB-NP parcellation (see (J) (43)).

