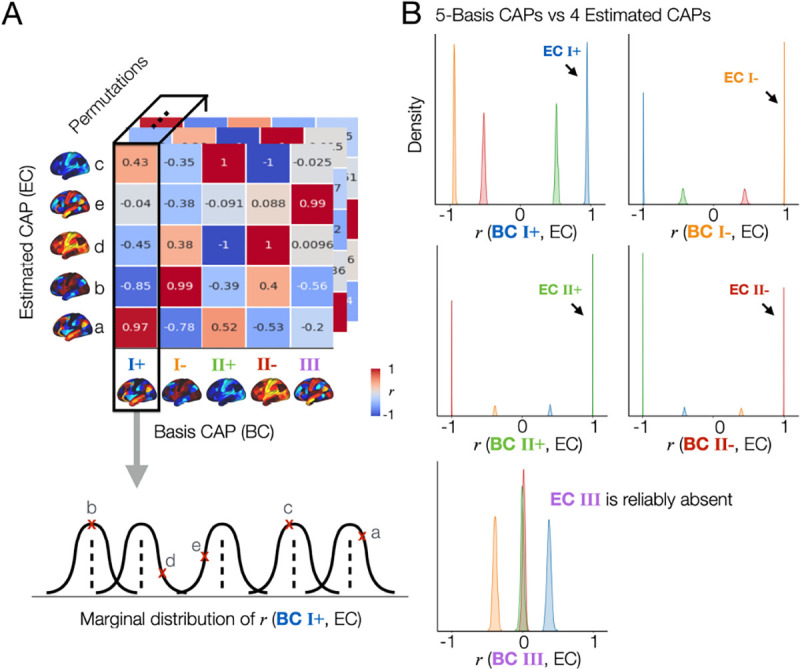
Fig. 2. The spatial patterns of the CAPs estimated across split-half permutations are reproducible, demonstrating the consistent absence of a specific spatial pattern (CAP III) in one split but not in another split across permutations.

(A) Proof of concept. First, we collect all CAPs estimated from the 502 permutations out of 1,000, where the proposed method estimated 4 CAPs from each data (Fig. 1C). Spatial similarity (r, correlation coefficient) is computed between each of the estimated CAPs (EC; denoted as a, b, c, d, and e) and a given basis CAP (BC). In this example, we select BC 1 from the 5-CAP basis set. r values were rounded to the nearest 2 decimal digits for visualization. Finally, we obtain the marginal distribution of r values between BC 1 and the estimated CAPs across 502 permutations. (B) The CAP III is reproducibly found in the 5-CAP solutions and not in the 4-CAP solutions across permutations. We repeated the spatial similarity analysis for the 4 CAPs estimated from each split-half data, when compared to the 5-CAP basis set. In each permutation, each estimated CAP was labeled according to the maximum rank correlation with the basis CAPs. Data-points (r-values) estimated from the CAPs with a same label were coded using the same color. The marginal distributions of r between all estimated CAPs and each BC from the 5-CAP basis set are illustrated using kernel density estimation. Results obtained from the split 1 data are shown in (B) and replicated in the split 2 data (see Supplementary Fig. S5).
