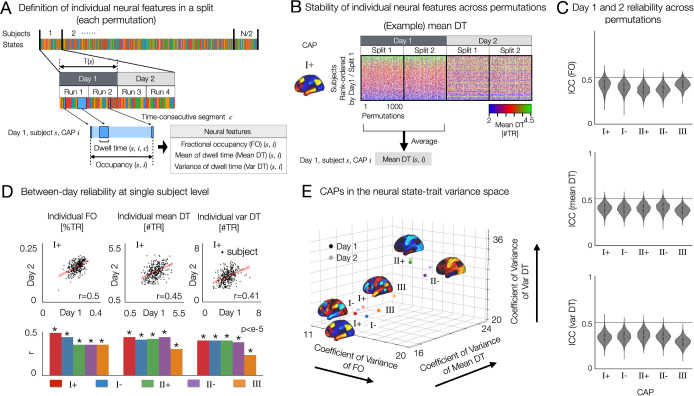
Fig. 3. Resting state brain CAPs have distinct between and within-subject variance of temporal characteristics and test-retest reliability, as revealed by the 3-axes representation of neural trait variance space.
(A) Analysis overview. In each split-half data from each permutation per day, fractional occupancy (FO), within-subject mean of dwell time (Mean DT) and within-subject standard deviation of dwell time (Var DT) are estimated for each CAP state. (B) Stability of individual mean DT of CAP I+ across permutations and across two days. Individual subjects were rank-ordered from top to bottom using the split 1 data from Day 1. We also found that individual Var DT and individual FO for these CAPs are reproducible across permutations and two days (Supplementary Fig. S6). (C) Days 1 and 2 reliability of FO (top), Mean DT (middle) and Var DT (bottom) in each CAP state were quantified by the intraclass correlation coefficient using two-way random effect models (ICC(2,1)). When computing ICC for CAP III, permutations resulting in the absence of CAP III was not considered, because the values of temporal metrics are zero for both days. (D) Test-retest reliability of neural measures between two days of scan. (top) Scatter plots of individual FO, within-subject mean and variance of DT between days 1 and 2 for CAP I+ state. r-value is estimated from the linear fitting lines (red) for each scatter plot. (bottom) The same analysis was performed for all CAPs (Supplementary Fig. S7) and summarized here using r-values. (E) CAPs on the neural trait variance space. Relative variance (coefficient of variance) of each CAP measure was computed across subjects: individual FO (x-axis), Mean DT (y-axis) and Var DT (z-axis). The three-axes representation allows for unifying and optimizing the variations of temporal CAP characteristics and distinct patterns of temporal organizations of brain activity.

