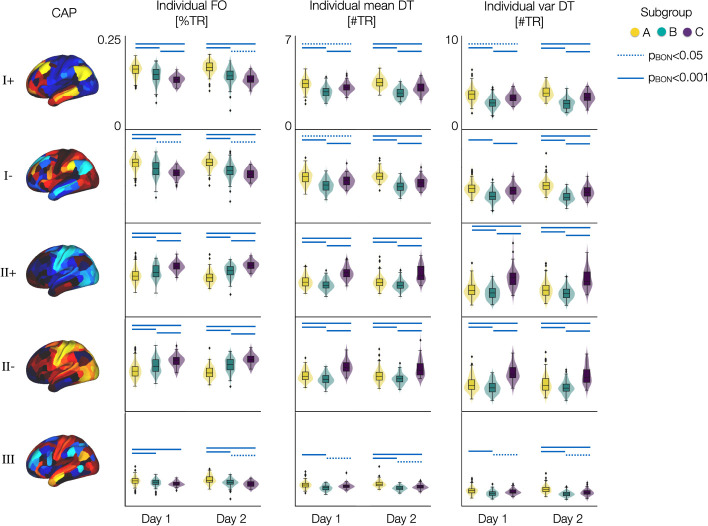
Fig. 5. Distribution of individual neural measures of spatio-temporal CAP dynamics differ between subgroups.
The distributions of individual FO, mean DT, and var DT of each CAP state are color-coded by the three subgroups (Fig. 4). Results from days 1 and 2 data are shown separately and compared between groups (Supplementary Fig. S8). Each data-point indicates a subject. Blue lines: p-values with Bonferroni-correction across five CAPs are estimated using two-sided two-sample t-tests between groups, pBON < .001 (bold) and pBON < .05 (dotted).

