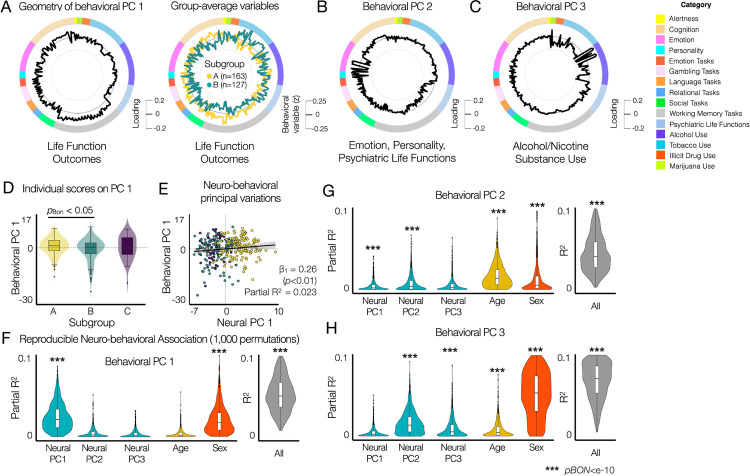
Fig. 6. Principal variations of neural state-trait features co-vary with the principal variations of behavioral phenotypes, highlighting individual life function outcomes associated with emotion regulation, cognitive function and alcohol and substance use.
(A) The geometry of behavioral PC 1 (black, left circle) reflects the difference in group-average behavioral variables (standardized behavioral data, right circle) between subgroups A (yellow) and B (green). Subgroup C is not shown because no significant group differences are found in (D). (B) The geometry of behavioral PC 2. (C) The geometry of behavioral PC 3. (D) Comparison of individual PC 1 scores between subgroups identified using neural state-trait measures (Fig. 4). Two-sample two-sided t-tests were performed between subgroups for each behavioral PC. pBON: Bonferroni corrected p-values. (E) Multiple linear regression model of three neural PC 1 with two covariates (age and sex) showed that the neural PC 1 was associated with the behavioral PC 1 (Partial R2 = 0.023, β1 = 0.26, SE = 0.09, t = 2.8, p = 0.006), where multiple R2 = 0.041, adjusted R2 = 0.026, F(5,331) = 2.814, p-value = 0.017 for the full model. (F-H) Reproducibility analysis of the prediction of individual behavioral PC scores from neural PCs. In each permutation, PCA was performed for the neural and behavioral data from subjects in a random half of the entire sample (N = 168). Parameters of multiple linear regression models with three neural PC 1 with two covariates (age and sex) were estimated to evaluate the predictability of each behavioral PC. pBON: Bonferroni corrected p-values from F-tests.

