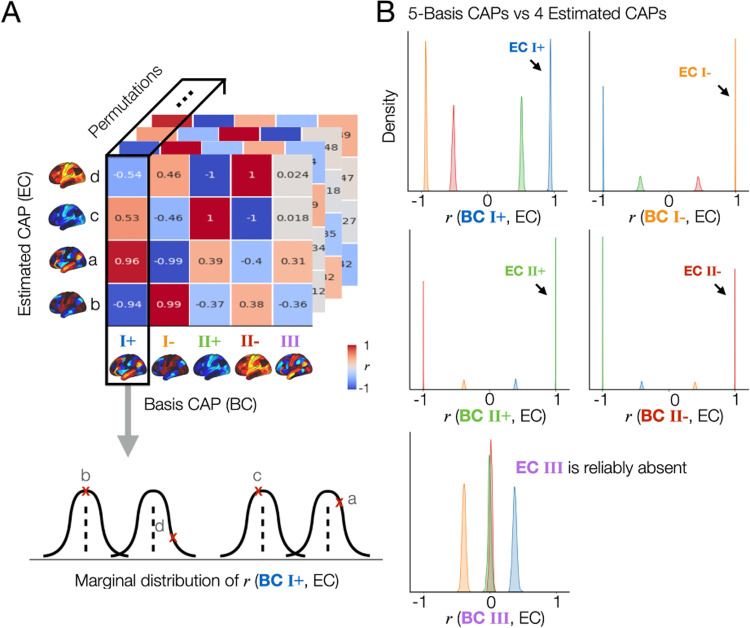
Fig. 2. The spatial patterns of the CAPs estimated across split-half permutations are reproducible, demonstrating the consistent absence of a specific spatial pattern (CAP III) in one split but not in another split across permutations.
(A) Proof of concept. In this figure, we demonstrate “whenever 4 CAPs are estimated from a split data, are their spatial patterns reproducible across the permutations”, and “if there is a specific CAP state that is reproducibly missing in 4-CAP solutions when compared to the 5-CAP solutions”. To address these, first, Among 1,000 permutations, we only take permutations that resulted in 4-CAP solutions using the elbow method, which was 502 permutations in this data. The remaining 498 permutations mostly resulted in 5-CAP solutions, and rarely 6- or 7-CAP solutions as shown in (Supplementary Fig. S3). Spatial similarity (r, correlation coefficient) is computed between each of the estimated CAPs (EC; denoted as a, b, c, and d) and a given basis CAP (BC). In this example, we select BC 1 from the 5-CAP basis set. r values were rounded to the nearest 2 decimal digits for visualization. Finally, we obtain the marginal distribution of r values between BC 1 and the estimated CAPs across 502 permutations. (B) The CAP III is reproducibly found in the 5-CAP solutions and not in the 4-CAP solutions across permutations. We repeated the spatial similarity analysis for the 4 CAPs estimated from each split-half data, when compared to the 5-CAP basis set. In each permutation, each estimated CAP was labeled according to the maximum rank correlation with the basis CAPs. Data-points (r-values) estimated from the CAPs with a same label were coded using the same color. The marginal distributions of r between all estimated CAPs and each BC from the 5-CAP basis set are illustrated using kernel density estimation. Results obtained from the split 1 data are shown in (B) and replicated in the split 2 data (see Supplementary Fig. S7). Note that all 718 cortical and subcortical parcels were included in this analysis. For simplicity, subcortical regions of CAPs are not visualized.

