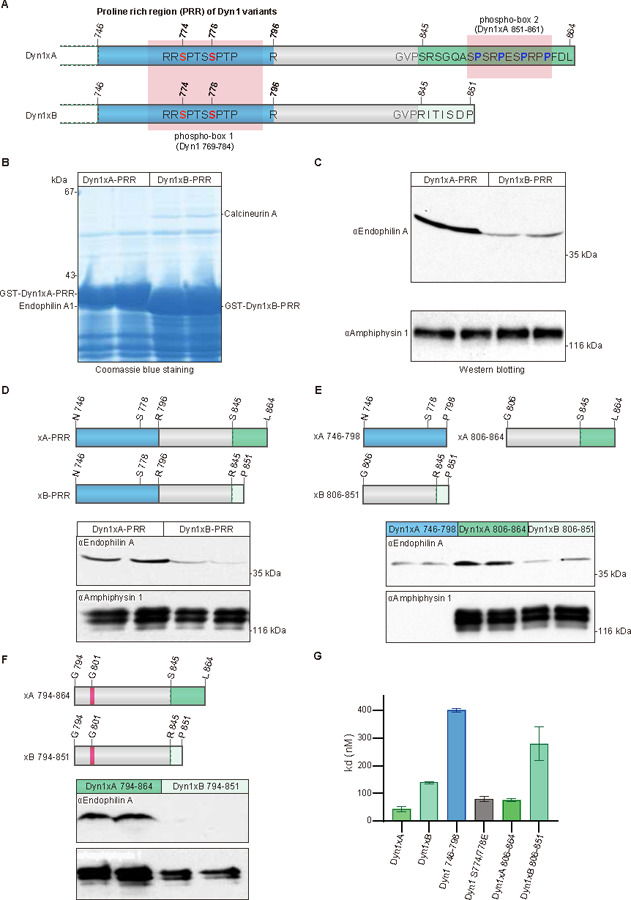
Figure 1. Endophilin A specifically associates with long-tail Dyn1xA.

(A) Schematic diagram represents the protein structural elements in proline rich region (PRR) of the Dyn1 splice variants. Dyn1xA and xB share identical amino acid sequence up to Pro844. Blue color shows previously reported Endophilin A binding region. Green color shows 20 amino acid extension of Dy1xA. Light green colour shows calcineurin binding sites specific to Dyn1xB. Ser845 is the splice site boundary.
(B) Synaptosomal lysates were incubated with GST-Dyn1-PRR (either xA or xB) coupled to GSH-sepharose beads. Bound proteins were separated by SDS-PAGE and stained with Coomassie blue. The bands marked as Endophilin A were subjected to LC-MS/MS analysis. Samples are from duplicate experiments. Note that the two GST-tagged PRR baits are overloaded and are of different sizes (left vs right panels).
(C) Bound proteins from pull-down experiments with GST-Dyn1-PRR (either xA or xB) were subjected to Western blot analysis with antibodies against endophilin A, amphiphysin 1, each being run in duplicate experiments.
(D-F) Schematic diagram represents truncated PRR used in pull-down experiments. Dyn1–746-798 contains the previously reported Endophilin A binding region (blue). Dyn1xA-794–864 and Dyn1xB-794–851 contain Glycine 801 (magenta) which has inhibitory role for Endophilin A binding. Corresponding synaptosomal lysates were incubated with truncation constructs (D) coupled to GSH-sepharose beads. Bound proteins were subjected to Western blot analysis with antibodies against Endophilin A and Amphiphysin 1. All conditions are performed on the same blot. Results shown are in duplicate samples from one of at least 3 independent experiments.
(G) ELISA assays used to determine the binding affinity, demonstrated that the C-terminus Dyn1xA-806–864 is has the major binding site for Endophilin A. His-tagged mouse Endophilin-SH3 domain was coated onto a 96-well plate and examined for the ability to bind to increasing concentrations of a variety of GST-tagged Dyn1-PRR peptides by an ELISA assay. The binding affinity (Kd) for GST-tagged each dynI-PRD construct was calculated based on two experiments, each containing four replicates. Mean ± SD is shown.
