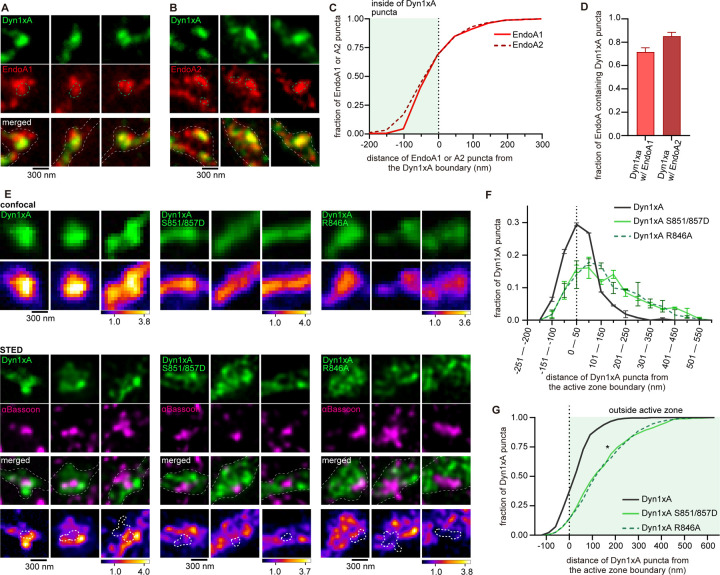
Figure 4. The C-terminal extension of Dyn1xA is required for its colocalization with Endophilin A1 and A2 at the endocytic zone.
(A and B) Example STED micrographs showing overexpression of GFP-tagged Dyn1xA (Dyn1xA) and mCherry-tagged Endophilin A1 (EndoA1) (A), mCherry-tagged Dyn1xA and GFP-tagged Endophilin A2 (EndoA2) (B). Green dashed line in Endophilin A1 or A2 images indicates boundary of Dyn1xA clusters defined by MATLAB script (see Methods). White dashed line in merged images indicate neuron shape based on background fluorescence.
(C) Cumulative plot representing distance of Endophilin A1 or A2 puncta from the Dyn1xA boundary. Negative values indicate local maxima of Endophilin puncta are inside the boundary of Dyn1xA puncta and positive values indicate outside.
(D) Fraction of Dyn1xA puncta contains Endophilin A1 or A2 within the boundary.
(E) Confocal micrographs (top panel) showing overexpression of GFP-tagged Dyn1xA, Dyn1xA S851D/857D or Dyn1xA R846A. Bottom panels show STED micrographs of the same synapses with an active zone marker Bassoon visualized by antibody. False-colored images show the relative fluorescence intensity of Dyn1xA or mutants. White thick dashed lines within false-colored STED images indicates the boundary of active zone based on the MATLAB analysis of Bassoon signals.
(F) The distribution of Dyn1xA, Dyn1xA S851/857D and R846A relative to the active zone edge. Negative values indicate local maxima of Dyn1xA or mutants puncta are inside the active zone, and positive values indicate outside.
(G) Cumulative plots of (F).
Median and 95% confidential interval is shown. *p < 0.05. More than 150 synapses are examined in each condition. n > 4 coverslips from 2 independent cultures.

