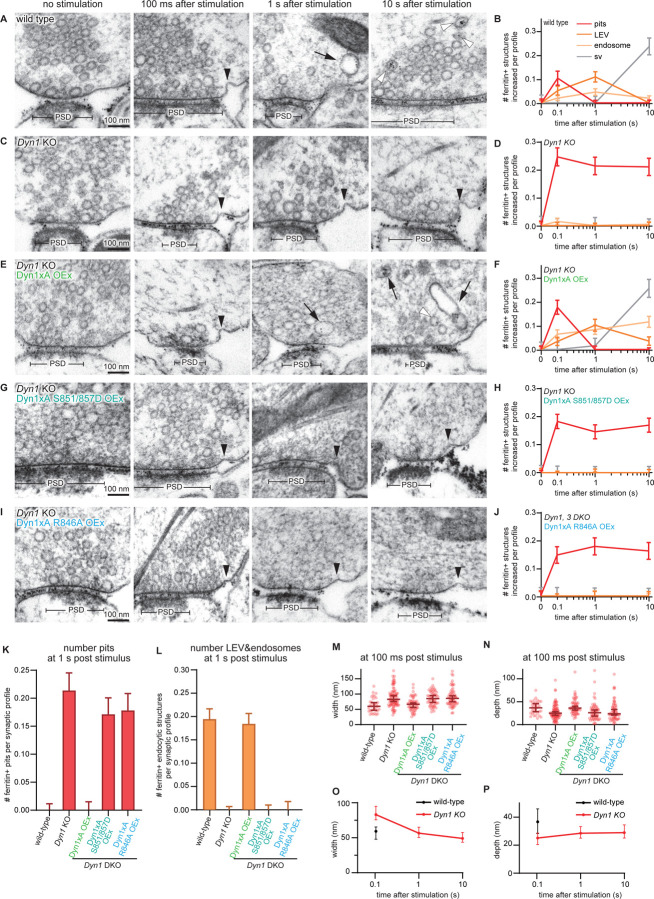
Figure 5. The Dyn1xA 20 amino acid extension is essential for ultrafast endocytosis.
(A, C, E, G and I) Example micrographs showing endocytic pits and ferritin-containing endocytic structures at the indicated time points in wild-type primary cultured mice hippocampal neurons (A), Dyn1 KO neurons (C), Dyn1 KO neurons, overexpressing Dyn1xA (Dyn1xA OEx) (E), Dyn1 KO neurons, overexpressing Dyn1xA S851/857D (Dyn1xA S851/857D OEx) (G) and Dyn1 KO neurons, overexpressing Dyn1xA R846A (Dyn1xA R846A OEx) (I). Black arrowheads, endocytic pits; black arrows, ferritin-positive large endocytic vesicles (LEVs) or endosomes; white arrowheads, ferritin-positive synaptic vesicles. Scale bar: 100 nm. PSD, post-synaptic density.
(B, D, F, H and J) Plots showing the increase in the number of each endocytic structure per synaptic profile after a single stimulus in wild-type neurons (A), Dyn1 KO neurons (C), Dyn1xA OEx neurons (E), Dyn1xA S851/857D OEx neurons, (G) Dyn1xA R846A OEx neurons (I). The mean and SEM are shown in each graph.
(K) Number of endocytic pits at 1 s after stimulation. The numbers are re-plotted as a bar graph from the 1 s time point in (B, D, F, H and J) for easier comparison between groups. The mean and SEM are shown.
(L) Number of ferritin-positive LEVs and endosomes at 1 s after stimulation. The numbers of LEVs and endosomes are summed from the data presented in (B, D, F, H and J), averaged, and re-plotted for easier comparison between groups. The mean and SEM are shown.
(M and N) Plots showing the width (M) and depth (N) of endocytic pits at the 100 ms time point. The median and 95% confidence interval are shown in each graph. n = wild-type, 33 pits, Dyn1 KO, 87 pits, Dyn1xA OEx, 56 pits, Dyn1xA S851/857D OEx, 55 pits, Dyn1xA R846A OEx, 60 pits. Median and 95% confidential interval is shown.
(O and P) Plots showing the width (O) and depth (N) changes over the time course in wild-type and Dyn1 KO neurons. n = wild-type, 33 pits at 100 ms, Dyn1 KO, 87 pits at 100 ms, 59 pits at 1 s and 62 pits at 10 s. Median and 95% confidential interval is shown.
All data are from two independent experiments from N = 2 mice primary cultured hippocampal neurons prepared and frozen on different days. n = wild-type, 849; Dyn1 KO, 806; Dyn1xA OEx, 805; Dyn1xA S851/857D OEx, 791; Dyn1xA R846A, 801 synaptic profiles in (B, D, F, H, J, K, and L). *p < 0.05. **p < 0.0001 See Quantification and Statistical Analysis for the n values and detailed numbers for each time point. Knock out neurons are from the mice littermates in all cases. Kruskal-Wallis Test with full comparisons by post hoc Dunn’s multiple comparisons tests.

