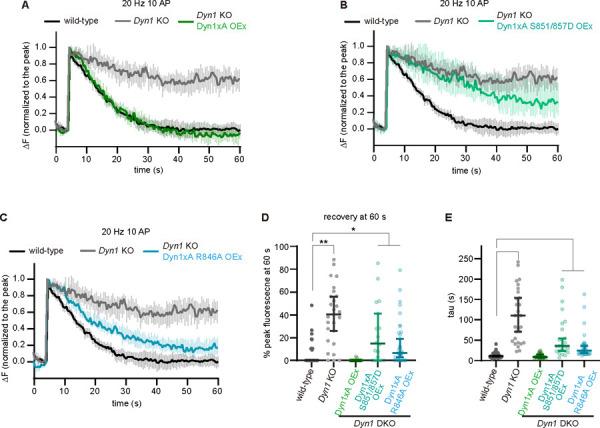
Figure 6. Dyn1xA and its long tail is important for endocytosis of synaptic vesicle protein.

(A-C) Plots showing average responses of vesicular glutamate transporter 1 (VGLUT1)-pHluorin in DNM1+/+ (wild-type), DNM1−/− (Dyn1 KO), Dyn1 KO neurons, overexpressing Dyn1xA (Dyn1KO Dyn1xA OEx) (A), Dyn1 KO neurons, overexpressing Dyn1xA S851/857D (Dyn1KO Dyn1xA S851/857D OEx) (B) or Dyn1 KO neurons, overexpressing Dyn1xA R846A (Dyn1KO Dyn1xA R846A OEx). Mouse primary cultured hippocampal neurons were stimulated at 20 Hz, 10 action potentials (AP). The fluorescence signals are normalized to the peak for each bouton. Neurons are stimulated from 5 s to 5.5 s.
(D) The percentage of peak fluorescence remaining at 60 s after the beginning of the imaging.
(E) The time constant for fluorescence recovery following 20 Hz, 10 AP. The time constants were obtained by fitting each pHluorin trace to a single exponential decay. The time constant is displayed as Median with 95% confidential interval.
n > 25 presynaptic boutons from three different coverslips in each condition. N = 1 culture at DIV14. *p < 0.05. **p < 0.0001 See Quantification and Statistical Analysis for the n values and detailed numbers for each time point. Knock out neurons are from the littermates in all cases. Kruskal-Wallis Test with full comparisons by post hoc Dunn’s multiple comparisons tests.
