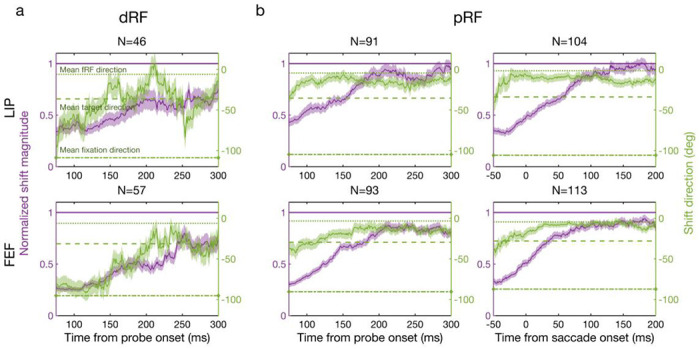
Fig. 5.

Remapping time courses of the delay (a: dRF) and perisaccadic (b: pRF) periods for LIP (top row) and FEF (bottom row). Each panel shows the mean normalized shift magnitude (purple curve, left y-axis) and the mean shift direction (green curve, right y-axis) as a function of time. The amplitude of one (purple horizontal line) means a shift magnitude equals the saccade magnitude. The average fRF, target, and initial-fixation directions are indicated by the green dotted, dashed, and dot-dashed lines, respectively. Each data point is calculated from the responses of the 50-ms window centered around that point. The light purple and green regions indicate 1SEM. The third column is based on saccade onset alignment of the repeated trials whereas the other columns are based on the probe onset alignment.
