Figure 1.
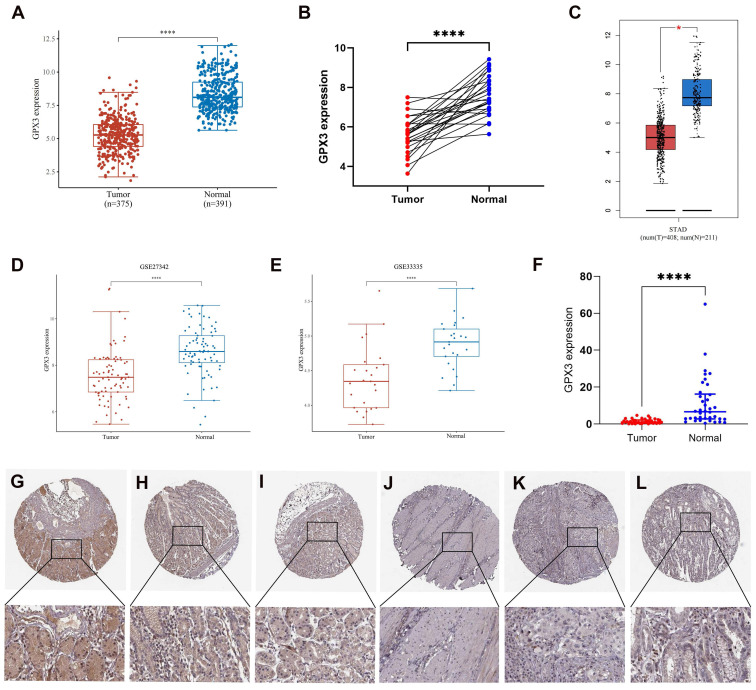
Expression analysis for GPX3 in GC. (A) GPX3 expression in tumor and normal tissues in GC based on TCGA and GTEx datasets. (B) GPX3 expression in 26 GC tissues and donor-matched normal tissues based from TCGA. (C) GPX3 expression in tumor and normal tissues in GC from GEPIA. (D-E) GPX3 expression in GC tissues and normal tissues from GSE27342 and GSE33335. (F) GPX3 expression in 38 pairs GC tissues and adjacent normal tissues (from Tianjin Medical University General Hospital). (D) (G-I) Representative IHC staining of GPX3 in normal gastric tissues. (J-L) Representative IHC staining of GPX3 in GC tissues. *p < 0.05, **** p < 0.0001.

