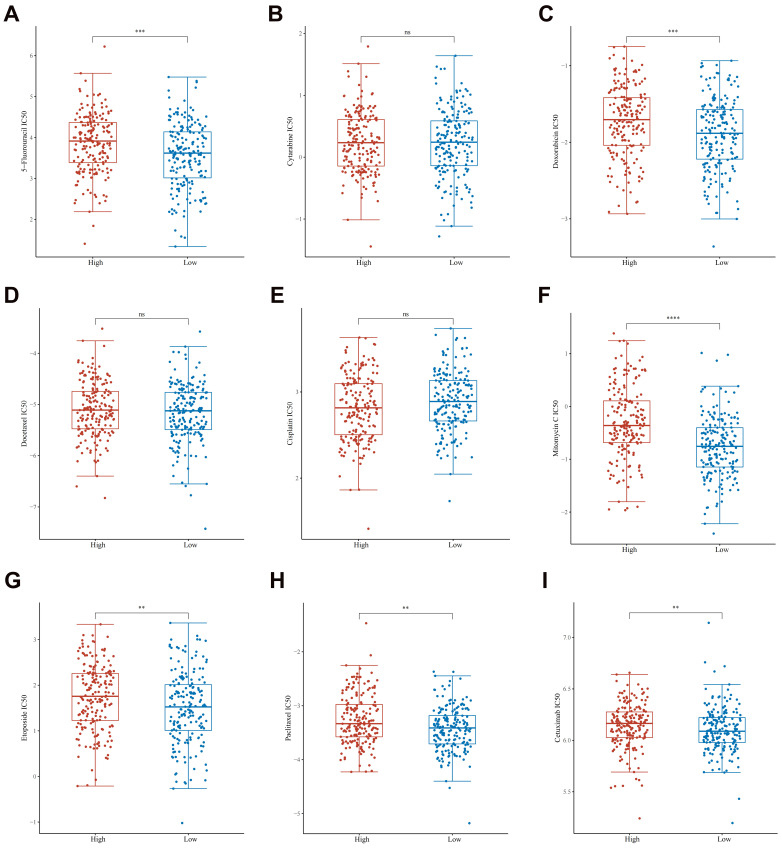
Figure 9.
The distribution of IC50 scores of 9 drugs in GPX3 high and low expression groups in GC. The ordinate represents the distribution of the IC50 scores of 5-fluorouracil (A), cytarabine (B), doxorubicin (C), docetaxel (D), cisplatin (E), mitomycin (F), etoposide (G), paclitaxel (H) and cetuximab (I). **p < 0.01, ***p < 0.001, **** p < 0.0001.

