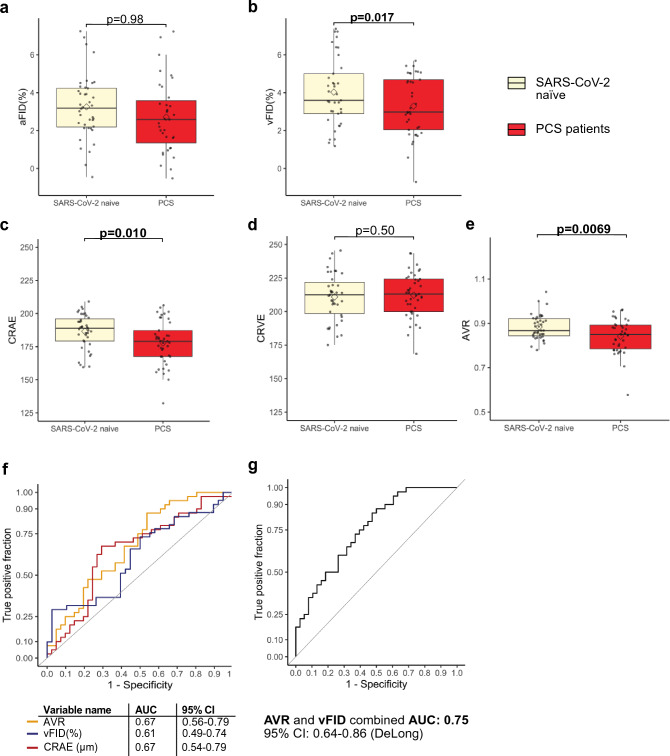
Fig. 1.
Flicker induced dilation and static retinal vessel analysis in PCS patients and HC control. a Boxplots show arteriolar dilatation (aFID) and venular dilation (vFID) (a and b) and SVA parameters CRAE, CRVE and AVR (c, d and e) in PCS patients (red) and SARS-CoV-2 naïve participants (beige). For RVA parameters boxplots represents data of n = 39 PCS patients and n = 39–40 SARS-CoV-2 naïve participants and for SVA parameters data of n = 41 PCS patients and n= 40 SARS-CoV-2 naïve participants. Mean values are shown as a rectangle and median values as a line. Wilcoxon rank sum test (skewed distributions) or Welch´s t test (normal distribution) were used to compare groups. f ROC curves show discrimination between PCS patients and infection naïve participants for AVR, vFID and CRAE. g ROC curve shows discrimination between PCS patients and infection naïve participants for AVR and vFID combined. AUC is presented with 95% confidence intervals (CI) calculated with DeLong´s method.

