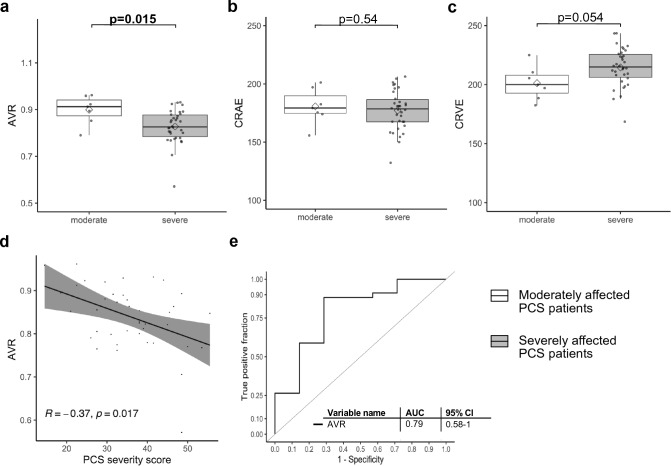
Fig. 2.
Parameters of retinal microvasculature in severely affected PCS patients. a, b and c Boxplot of SVA parameters CRAE, CRVE and AVR in seven moderately affected PCS patients (PCS severity score > 10.75 and ≤26.25) (white) and 34 severely affected PCS patients (PCS severity score >26.25,) (grey). Boxplots show values as mean (rectangle) and median (line). To compare groups Wilcoxon rank sum test was used for skewed data and Welch´s t-test for normally distributed data. d Scatterplot shows association between PCS severity score and AVR and the corresponding R and p-value. e ROC curves show discrimination between moderately and severely affected patients for AVR and the AUC with 95% confidence intervals (CI) calculated with DeLongs test.

