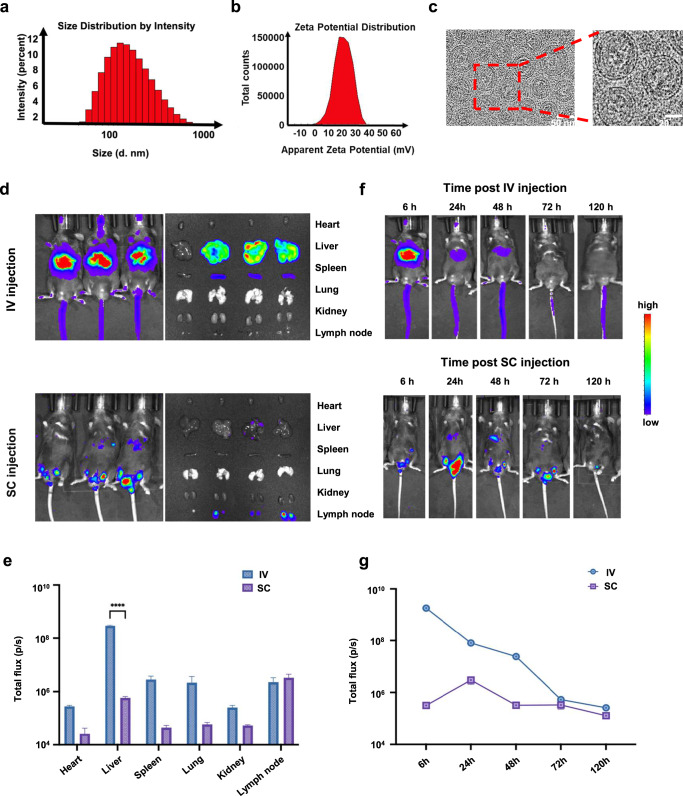
Fig. 2. Characterization of mRNA-LNPs.
a Size number and b Zeta potential distribution of LNPs. c Cryo-TEM images of LNPs. d Biodistribution and e Quantitative analysis of luciferase expression in mice after 6 h following IV and SC administration of LNP@Luc-mRNA vaccine (n = 3). f Biodistribution and g Quantitative analysis of luciferase expression in mice over time following IV (left) and SC (right) vaccination with LNP@Luc-mRNA (Error bar = mean ± SEM, n = 3). Statistics were assessed by one-way ANOVA with Tukey’s multiple comparison tests. *P < 0.05 was considered statistically significant. **P < 0.01 and ***P < 0.001 were considered highly significant. LNP lipid nanoparticle, IV intravenous, SC subcutaneous, LNP@Luc-mRNA nanoparticles loaded with mRNA encoding luciferase.

