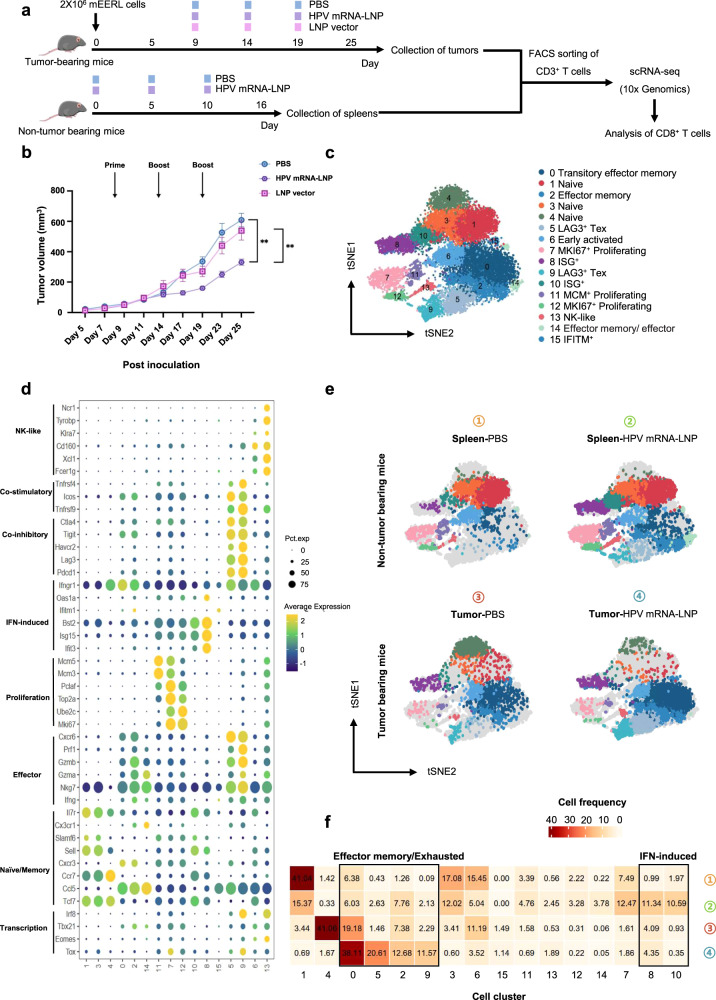
Fig. 4. ScRNA-seq of CD8+ T cells demonstrates IFN-induced and exhausted cell accumulation induced by HPV mRNA-LNP vaccination.
a Schematic of the therapeutic study design. Mice were implanted with mEERL cell line and treated with HPV mRNA-LNPs on day 9, 14, and 19 (n = 10). CD3+ T cells in tumors from TB mice were sorted using flow cytometry on day 25 (6 days after the third dose of vaccination). CD3+ T cells in spleens from non-TB mice were also sorted using flow cytometry on day 16 (6 days after the third dose of vaccination) as control. b Tumor growth following treatment (Error bar = mean ± SEM, n = 10). Statistics were assessed by one-way ANOVA with Tukey’s multiple comparison tests. *P < 0.05, **P < 0.01 and ***P < 0.001. c Distribution of sorted CD8+ T cells projected onto t-SNE map. d Dot plot of canonical markers identifying specific CD8+ T cell subsets. e T-SNE maps of CD8+ T cell subsets in the spleens of non-TB mice and the tumors of TB mice, respectively. f Heatmap of cluster-wise cell frequencies for each combination of treatment and tissue. Cell frequency was presented as the percentage of each cluster in all cells (the sum of the values in each row is 100%). TB tumor bearing.

