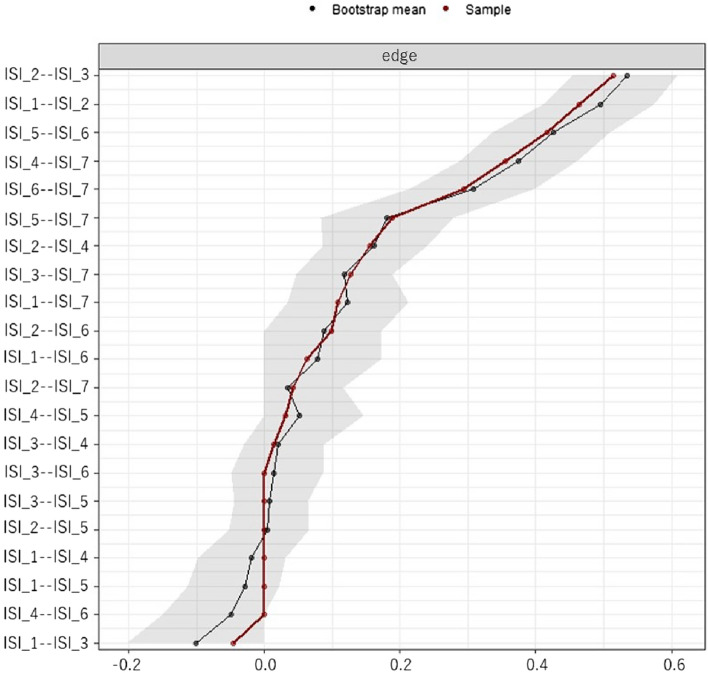
Figure 4.
Bootstrap confidence intervals were estimated to indicate the magnitude of the edges-weighted between variables in the network structure. The gray ranges are the bootstrap confidence interval. The dots are plotted polychoric correlation coefficient values. Abbreviations: Difficulty falling asleep (ISI_1), Difficulty staying asleep (ISI_2), Problem waking up too early (ISI_3), Dissatisfaction (ISI_4), Interference with daytime functions (ISI_5), Noticeable to others (ISI_6), and Worry/Distress (ISI_7).

