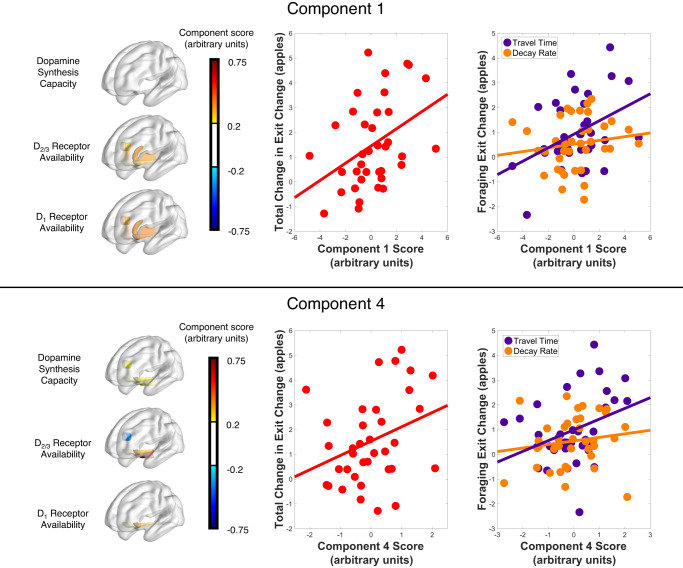
Fig. 5. Correlation of dopamine PCA components 1 and 4 with total change in leaving threshold.
Images on the left are the component weightings for PCA components 1 (top) and 4 (bottom). The middle plots (in red) show that individuals who made greater adjustments in their patch-leaving threshold had higher scores for PCA component 1 and component 4 (linear regression model with all four components F = 3.35, p = 0.0213, two-sided, n = 37 individual participants; component 1 t = 2.699, p = 0.011, component 4 t = 2.390, p = 0.0229). The right-hand plots show that dopamine PCA components 1 and 4 are positively correlated with change in travel time and but not with change in decay rate. Component 1 (top): linear regression model F = 3.78, p = 0.0328, two-sided; threshold change due to travel time t = 2.579, p = 0.0144, threshold change due to decay rate t = 0.760, p = 0.453. Component 4 (bottom): linear regression model F = 2.64, p = 0.0861, two-sided, threshold change due to travel time t = 2.116, p = 0.0417, threshold change due to decay rate t = 0.730, p = 0.470. Reported p-values are unadjusted. Source data are provided as a Source Data file.

