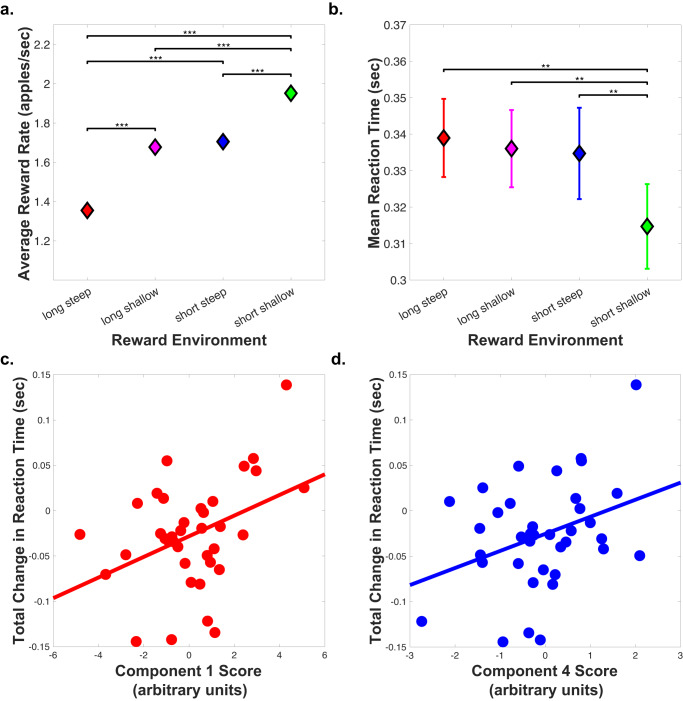
Fig. 6. Correlation of dopamine PCA components and change in reaction time.
a Average of the reward rate across subjects in each reward environment (n = 56 individual participants). Data are presented as mean +/− standard error of the mean (SEM). Paired t-tests revealed that the average reward rate was lower in the long-steep reward environment compared to the long-shallow (p = 1.51e−19), short-steep (p = 3.47e−21), and short-shallow (p = 3.40e−28) environments. In addition, the average reward rate was higher in the short-shallow reward environment compared the long-shallow (p = 7.68e−16) and short-steep (p = 4.12e−13) environments. b Average reaction time across subjects in each reward environment. Data are presented as mean +/− SEM. Paired t-tests showed that the reaction time in the short-shallow reward environment is quicker than the long-steep (p = 0.0022), long-shallow (p = 0.0034), and short-steep (p = 0.0045) environments. c Correlation between total change in reaction time between the short-shallow and long-steep reward environments and dopamine PCA component 1 score (r = 0.395, p = 0.0155). d Correlation between total change in reaction time and dopamine PCA component 4 score (r = 0.349, p = 0.0343). Linear regression model including both components 1 and 4 scores as the independent variables predicting the dependent variable, change in reaction time, revealed a significant model with F = 6.57, p = 0.00386. Both components were significantly associated with the change in reaction time: component 1: t = 2.704, p = 0.0106; component 4: t = 2.406, p = 0.0217. Results from paired t-tests are indicated on the figure as follows: *p < 0.05, **p < 0.01, ***p < 0.001. Source data are provided as a Source Data file.

