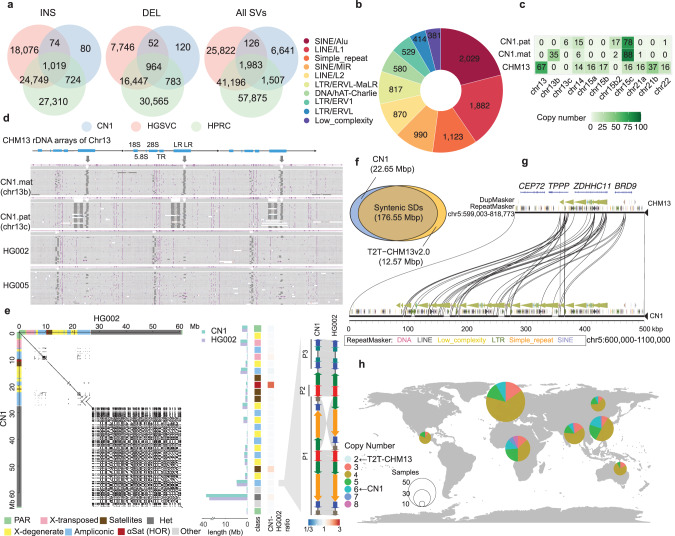
Fig. 3. SVs between CN1 and CHM13.
a Comparison of SVs between CN1 and CHM13 based on HGSVC and HPRC databases. b Repeat annotation of novel SVs, top 10 for plot. c Copy number of rDNA models across three haploid genomes, CN1.mat, CN1.pat, and CHM13. d Illustration of chr13 rDNA model in CN1, HG002, and HG005. CHM13 chr13 rDNA model is shown on the top, and the ONT read alignments in the different haploids/individuals are shown below. Compared to the CHM13 reference, the CN1.mat chr13 rDNA model has one 4.4 kb deletion in LR, and the CN1.pat chr13 rDNA model has an additional 1 kb deletion in LR. In HG002 and HG005, only a few copies of rDNA array contain the 1.1 kb deletion in LR. Each row represents a read alignment, with insertions shown as purple triangles and deletions shown as dark lines. e Comparison of CN1-Y and HG002-Y. The dot plot on the left shows the overall synteny between the two Y chromosomes, with a large inversion in the last ampliconic region. The middle barplot shows the size comparison for the different subregions on the two Y chromosomes. The major size differences are found in centromere, DYZ19, and heterochromatin. The synteny plot on the right shows the largest inversion on Y in one arm of palindrome P1 in the last ampliconic region. P1, P2 and P3 indicate palindromes 1, 2 and 3, respectively. f Venn diagram shows the syntenic and non-syntenic SDs (except chrY) of CN1 (blue) and CHM13 (orange). g Syntenic comparison of ZDHHC11 and its flanking region between CN1 and CHM13 genomes. The copy number of ZDHHC11 is expanded in CN1. h Global map shows the distribution of ZDHHC11 copy number across 317 human samples from the Simons Genome Diversity Project (SGDP). Color indicates the ZDHHC11 copy number and the size of the circles indicates the individual number examined in each super-population. There are two and six copies of ZDHHC11 in CN1 and CHM13, respectively.

