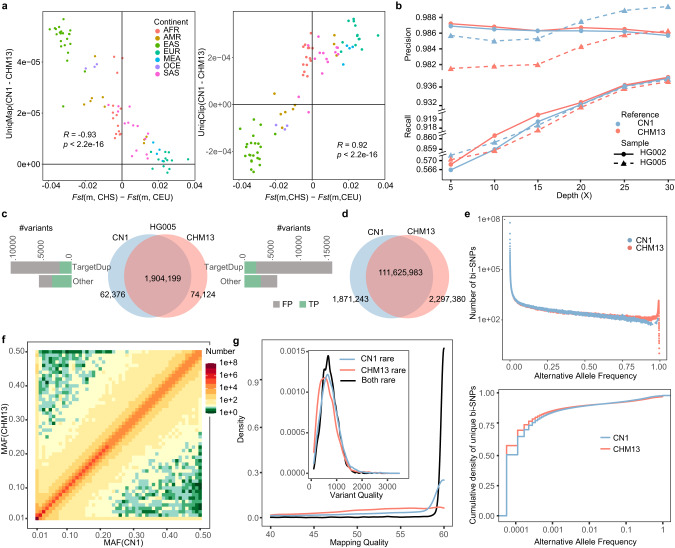
Fig. 5. Reference bias using CN1 and CHM13 genomes for population genomic analyses.
a The mapping statistics (left, unique mapping rate; right, unique clipping read rate) and their Pearson’s correlation with the difference in genetic distance (Fst) between the targeted population and the Southern Chinese (CHS) and Northern and Western European (CEU). Both graphs are plotted using n = 80 populations. b The performance of SNP calling in two benchmark samples from GIAB, a European individual (HG002) and an East Asian individual (HG005), using CN1 or CHM13 as a reference. Recall rates are displayed on a truncated y-axis. c Venn diagram shows the comparison of heterozygous SNVs called on CN1 and CHM13 genomes using ~30× HG005 sequencing data. Reference-dependent unique SNVs were compared with the GIAB benchmarked truth set, and classified as the true positives (TPs) and the false positives (FPs). TargetDup SNVs, caused by CNVs between the two references, are the major source of reference-dependent SNVs and introduce more FPs and comparable TPs in CHM13 than in CN1. d Venn diagram shows the comparison of bi-SNPs called from the 8869 Chinese cohort on CN1 and CHM13. e The alternative allele frequency distribution of bi-SNPs from 8869 Chinese genomes called on both CN1 and CHM13 genomes (upper). The alternative allele frequency distribution of the unique SNPs called on either CN1 or CHM13 genome (lower). f Heatmap shows the MAF of SNPs called on CN1 and CHM13. Most SNPs exhibit similar MAF in both references, while a few show distinct MAF between the two references (rare with CN1 but common with CHM13, and vice versa). More CN1 rare SNPs (upper left) are found than CHM13 rare SNPs (lower right). g Density distribution of mapping quality and variant quality of “Both rare” (rare SNPs called with both CHM13 and CN1), “CN1 rare” (rare with CN1 but common with CHM13), and “CHM13 rare” (rare with CHM13 but common with CN1) SNPs.

