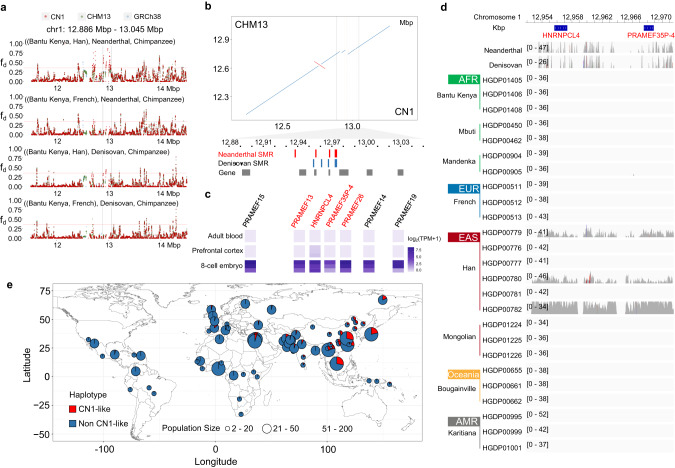
Fig. 6. A pIR from archaic genomes in the East Asian population identified using CN1 as a reference.
a Distribution of modified D-statistics fd values along chromosome 1 in ABBA-BABA test. Four comparisons were set in topology ((P1, P2), P3, Outgroup), where outgroup was Chimpanzee, P1 was Bantu Kenya, P2 was Han (EAS) or French (EUR), and P3 was Neanderthal or Denisovan genome. Three reference genomes were used, and the window coordinates in CHM13 and GRCh38 were converted into those in CN1 by LiftOver. The interval between the two vertical lines highlights the pIR in Han. The red horizontal line represents the empirical cutoff (fd = 0.35). b Local synteny between CN1 and CHM13. Red vertical lines indicate the genomic positions of the annotated genes in CN1. SMRs for Neanderthal and Denisovan are marked in red and blue, respectively. c Expression profiling of four newly annotated genes (red) and flanking genes located in the pIR in CN1. d Mapping depths of different modern human population genomes onto CN1. Each of the depth tracks ranges from zero to the whole-genome depth, respectively. e Global distribution of CN1-like haplotype frequency in 75 populations.

