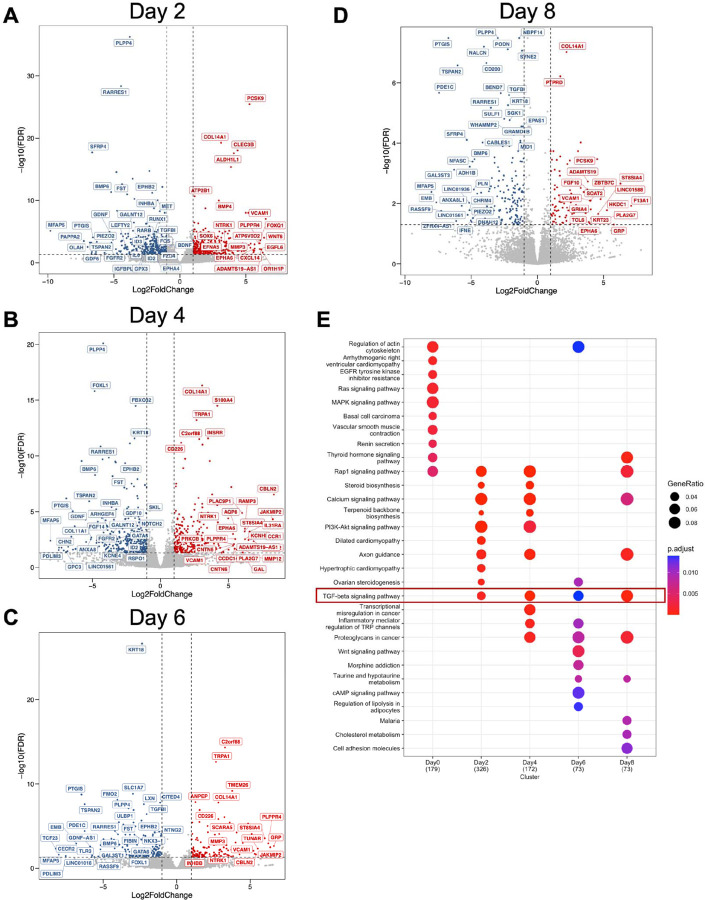
Figure 2. BMP/TGFβ signaling pathways are defective in the decidualizing stromal cells from individuals with endometriosis.
Differentially expressed genes between the endometrial stromal cells of individuals without (n=4) or with endometriosis (n=3) at each time point during the decidualization treatment were identified and visualized as volcano plots. Differentially expressed genes were determined using a cut off (|log2 fold-change| >1 and FDR < 0.05, red denotes increased genes, blue denotes decreased genes, gray indicates no significant change) and displayed following Day 2 (A), Day 4 (B), Day 6 (C), or Day 8 (D) of treatment with the EPC decidualization cocktail (35nM estradiol, 1µM medroxyprogesterone acetate, 50µM cAMP). E) Gene ontology analysis of the differentially expressed genes was performed at each time point and visualized as a Dot Plot. Genes in the TGFβ signaling pathway were identified to be enriched at each of the time points after EPC treatment.

