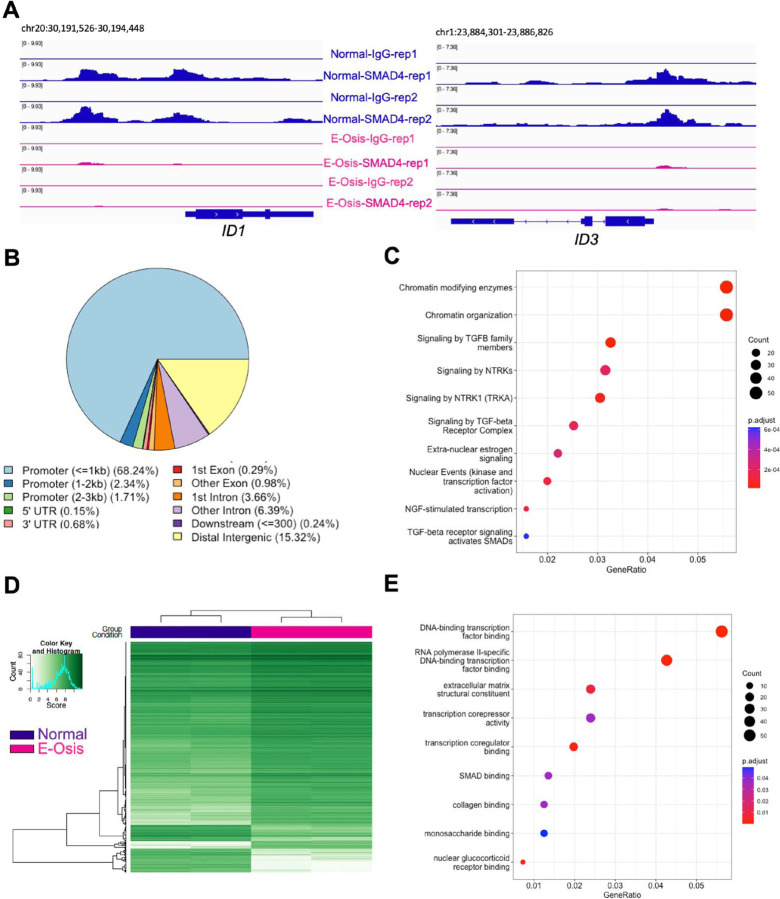
Figure 4. SMAD4 and H3K27ac CUT&RUN reveals differential binding events in the endometrial stromal cells of individuals with endometriosis.
CUT&RUN was performed for SMAD4 and H3K27ac in endometrial stromal cells from individuals with or without endometriosis to identify differences or similarities in their genome-wide distribution. A) Genome track views for the ID1 and ID3 genes displaying the enriched SMAD4 peaks obtained from the normal cells (blue) that are decreased in the endometriosis cells (pink). B) Peak annotation of the SMAD4 peaks in 2060 peaks showing differences in signal intensity between normal and endometriosis samples, showing many of the differential peaks (72.29%) were located proximal to the promoter region (within ± 3 kb promoter region). C) Reactome analysis showing classification of genes that were differentially bound by SMAD4 in the endometriosis samples. Chromatin modifications and signaling by TGFβ family members were in the top three categories. D) H3K27ac CUT&RUN was performed in endometrial stromal cells from individuals without endometriosis (“Normal”) or with endometriosis (“E-Osis”) after 4 days of EPC treatment. The heatmap shows the peak signal obtained for H3K27Ac in normal versus endometriosis stromal cells. E) Gene ontology classification of the 1122 peaks that were more enriched in the endometriosis samples.

