

Summary:
B cells can express pro-inflammatory cytokines that promote a wide variety of immune responses. Here we show that B cells expressing the phosphatidylserine receptor TIM-4, preferentially express not only IL-17A, but also IL-22, IL-6, and GM-CSF - a collection of cytokines reminiscent of pathogenic Th17 cells. Expression of this proinflammatory module requires B cell expression of IL-23R, RORγt and IL-17. IL-17 expressed by TIM-4+ B cells not only enhances the severity of experimental autoimmune encephalomyelitis (EAE) and promotes allograft rejection, but also acts in an autocrine manner to prevent their conversion into IL-10-expressing B cells with regulatory function. Thus, IL-17 acts as an inflammatory mediator and also enforces the proinflammatory activity of TIM-4+ B cells. TIM-4 serves as a broad marker for effector B cells (Beff) that will allow the study of the signals regulating their differentiation and expression of their effector molecules.
Keywords: TIM-4, B cell, Immunoregulation, EAE, Allograft, Th17, IL-17, Cytokines
INTRODUCTION:
In addition to a primary role in humoral immunity, B cells are potent modulators of the immune response through antigen presentation, co-receptor engagement and production of cytokines1–6. Regulatory B cells (Bregs) inhibit immune responses through the expression of suppressive cytokines and coinhibitory molecules1,2,4,7. The phosphatidylserine receptor, TIM-1, is both a broad and functional marker for Bregs that play an essential role in restraining tissue inflammation and maintaining self-tolerance7,8. In addition to being a marker of Breg identity, TIM-1 signaling regulates the expression of a “regulatory module” that includes IL-10 and various coinhibitory molecules including TIGIT7. As such, specific deletion of TIM-1 in B cells results in spontaneous systemic autoimmunity characterized by inflammatory infiltration of multiple organs and accompanied by clinically apparent weight loss/colitis with rectal prolapse and EAE-like paralysis.
In contrast to Bregs, effector B cells (Beffs), express proinflammatory cytokines that promote anti-microbial responses, autoimmunity, and allograft and tumor rejection2,4,5,9. For example, B cell-derived IL-2 and TNFα are required for clearance of H. polygyrus infection10. B cell-derived IL-6 enhances Th1 and Th17 responses and increases the severity of EAE, a model of multiple sclerosis in humans. Further, B cell-derived IFNγ promotes Th1 responses and is required for the generation of proteoglycan-induced arthritis11,12. During T. Cruzii infection, a pathogen-associated trans-sialidase was reported to specifically induce IL-17A expression in plasma cells through a RORγt-independent mechanism, promoting pathogen clearance13. However, a wider role for IL-17A in Beff functions has not been identified.
Unlike Bregs, the phenotype of Beffs has not been well studied. The lack of a marker identifying Beffs impedes our understanding of their generation and effector functions. While we previously showed that TIM-4+ B cells are enriched for IFNγ and enhance tumor and allograft rejection in an IFNγ-dependent manner9, no more broadly unifying marker for Beffs has been identified. It remains unclear whether Beffs expressing different inflammatory cytokines are related in phenotype or are regulated by common signaling mechanisms. It is also unknown whether Bregs and Beffs share any phenotypic or functional relationship. Here, we use highthroughput sequencing and murine models of autoimmunity and transplantation to characterize the role of TIM-4+ Beffs. We demonstrate that in addition to IFNγ, TIM-4+ B cells express a unique pro-inflammatory signature including IL-17A and a number of other proinflammatory cytokines in a RORγt and IL-23-dependent manner that resembles pathogenic Th17 cells. B cell IL-17A is not only a potent driver of inflammatory responses but is required as an autocrine factor to enforce expression of the TIM-4+ B cell proinflammatory phenotype and prevent their conversion into IL-10-expressing B cells with regulatory function. Thus, TIM-4 is a marker that integrates many of the inflammatory B cell cytokines previously ascribed to Beffs and we identify a dual role for IL-17A as a proinflammatory cytokine and regulator of Beff versus Breg identity.
RESULTS:
TIM-4+ B cells express IL-17A in a RORγt-dependent manner.
As previously shown, TIM-4 is expressed on a subset of splenic B cells similar in size but largely distinct from TIM-1+ B cells (Figure 1A)9. In addition to being enriched for IFNγ expression, we now show that TIM-4+ B cells from alloimmunized mice are also enriched for IL-17A production compared to total B cells or TIM-1+ B cells (Figure 1B–C). Given their relatively low frequency of IL-10 expression, TIM-4+ B cells have a markedly higher IL-17A:IL-10 ratio than TIM-1+ B cells (Figure 1B–D). In contrast, the majority of B cells lack either TIM-1 or TIM-4 (double negative; DN) and produce less IL-10, IL-17A or IFNγ, than either TIM-1+ or TIM-4+ B cells (Figure 1B and9). A large majority of all B cell-derived IL-17A is produced by the TIM-4+ subset as confirmed by staining B cells from alloimmunized IL-17A GFP-reporter mice for TIM-4 (Figure 1E; Supplementary Figure 1A shows gating strategy). In comparison, IL-17A production by T cells was only 20% as frequent, although of higher fluorescence intensity (Supplementary Figure 1B). Similar levels of IL-17A were observed after immunization of mice for EAE (MOG35–55, CFA, and pertussis toxin), suggesting that IL-17A production is a generalized response by a portion of TIM-4+ B cells to immunizing stimuli (Supplementary Figure 1C, D). Finally, IL-17A production by B cells was RORγt-dependent as it is in T cells (Supplementary Figure 1E).
Figure 1.

TIM-4+ B cells are distinct from those expressing TIM-1+ and preferentially express IL-17A. Splenic B cells from C57BL/6 mice analyzed 14 days after i.p. alloimmunization with mitomycin C–treated BALB/c splenocytes. Numbers within flow plots represent percentages of gated cells within that quadrant. (A) Representative flow cytometry plot of TIM-1 and TIM-4 expression on CD19+ B cells. (B) Representative flow cytometry plots of IL-10 and IL-17A expression on total (CD19+) B cells, and TIM-1-TIM-4- (DN), TIM-1+, and TIM-4+ B cell subpopulations. IL-10 expression is determined by GFP reporter expression (gating based on GFP-negative littermates; not shown). IL-17A expression is determined by intracellular staining with gating based on isotype controls (Control; bottom row). Cytokine expression was examined after stimulation for 5 hours with LPS, PMA, ionomycin plus monensin (LPIM) for IL-10, and PMA, ionomycin plus brefeldin A (PIB) for IL-17A. (C) Bar graph showing mean frequency (+ SD) of IL-10 and IL-17A expression on TIM-1+ vs. TIM-4+ B cells based on flow cytometry as in (B). n≥3 mice per group. (D) Bar graph showing the ratio of IL-17A+/IL-10+ cells within TIM-1+ and TIM-4+ B cell subsets (mean + SD) based on data in (C). (E) Representative FACS plots showing TIM-4 and IL-17A-EGFP expression on unstimulated vs. PIB stimulated CD19+ Dump gate-negative (CD3, CD64, Gr1, Ter119) B cells from alloimmunized IL-17A-EGFP reporter mice. (F) Sort-purified TIM-4+ and TIM-4- CD19+ B cells were stimulated with anti-IgM and IL-23 for 24 hours followed by PMA/Ionomycin for the final 5 hours. IL-17A concentration in the supernatants was measured by Cytometric Bead Array. n=3 mice per group. Statistical significance: * p< 0.05 vs. other groups; ** p<0.01 vs. other groups.
To determine whether IL-17A production could be enhanced in vitro, sort-purified CD19+ B cells from naïve IL-17-EGFP reporter mice were stimulated with anti-IgM for 24 hours with or without the addition of various cytokines. After culture, bright EGFP-fluorescence was observed on a subset of B cells marked by the activation antigen Sca-1, and EGFP expression was increased 8–12-fold by the addition of IL-23 (Supplementary Figure 2A, B). To a lesser degree, IL-1β also increased IL-17A production by anti-IgM-stimulated B cells, and the combination of IL-23 and IL-1β was synergistic, while IL-6 had a small additive effect. Addition of IL-21 and IL-17A alone or in combination with IL-23 did not further increase IL-17A expression. CD40 ligation with or without anti-IgM, did not enhance IL-17A production (not shown). To corroborate IL-17A production by intracellular staining and reporter expression, we examined cytokine secretion by sort-purified TIM-4+ versus TIM-4− B cells. TIM-4+ B cells stimulated for 24 hours with anti-IgM secrete IL-17A, but only in the presence of IL-23 (Figure 1E). In contrast, TIM-4− B cells did not secrete detectable IL-17A. Finally, we demonstrated that stimulated TIM-4+ but not TIM-4− B cells express Il-17a mRNA after stimulation with anti-IgM plus IL-23 (Supplementary Figure 2C), which shows that IL-17 is indeed produced by the TIM-4+ B cells themselves, rather than being acquired from other cells. Thus, TIM-4+ B cells express Il-17a in a RORγt-dependent manner and this is induced by IL-23.
B cells and plasma cells both produce IL-17
To determine the extent of IL-17A production by B cells versus plasma cells (PCs) in RORγt-dependent IL-17A expression, BLIMP-1-YFP mice were alloimmunized with or without in vitro stimulation with PMA and ionomycin plus brefeldin A (“PIB”) for 5 hours to enhance cytokine expression. BLIMP-1-YFP was used to distinguish between plasma cells and B cells. Splenic CD19+ B cells were stained for both cell surface markers and intracellular IL-17A, and gated into 3 subpopulations, as shown in Figure 2A: B220bright BLIMP-1-YFP− conventional B cells (comprising 95 +/−1.0% of the gated population), B220bright BLIMP-1-YFP+ cells, termed here “pre-plasmablasts” (pre-PBs; 1 +/−0.1 % of the gated B cell population), and B220dim BLIMP-1-YFP bright PCs (0.5 +/−0.24% of the gated population). PCs produced IL-17A at the highest frequency both before (~12%) and after (~27%) in vitro stimulation (Figure 2 B, C). Pre-PBs expressed IL-17A with less frequency, but ~2% still produced IL-17A without in vitro stimulation, and over 5% after stimulation. Finally, IL-17-producing conventional B cells were infrequent, but reproducibly detected (≤0.1%) even in the absence of stimulation. However, in vitro stimulation increased the frequency of IL-17+ B cells >12-fold (1.25%). Consistent with their relatively high production of IL-17, ~50% of PCs express TIM-4, and almost 90% of IL-17A+ PCs co-express TIM-4 (Supplementary Figure 3A–C). The relative size of each cell subset multiplied by the frequency of IL-17A production suggests that PCs and pre-PBs comprise ~50% of all IL-17A produced by the B cell lineage in the absence of in vitro stimulation. However, in vitro stimulation induces a many-fold greater increase in IL-17A production by the much more numerous conventional B cell population than PCs and Pre-PBs, whose contribution to B-lineage IL-17A now falls to ~12%. This situation is highly reminiscent of IL-10 production in B cells versus PCs, where a much higher proportion of PCs spontaneously produce IL-10, but B cell expression increases significantly upon in vitro stimulation14. Whether the presence or absence of in vitro stimulation most closely resembles the conditions occurring in critical inflammatory niches in vivo is not clear. Nonetheless, cytokine production observed in Th subsets is generally induced by in vitro stimulation.
Fig 2.

High frequency spontaneous IL-17A expression on plasma cells (PCs): Splenocytes from day 14 alloimmunized BLIMP-1-eYFP reporter mice (B6) were either unstimulated or treated with PIB for 5 hours and IL-17A expression was detected by intracellular staining. (A-B) Representative flow cytometry plots demonstrate the gating strategy for plasma cells (PCs; B220lo,BLIMP-1Hi), pre-plasmablasts (pre-PB; B220HiBLIMP-1+), and B cells (B220HiBLIMP-1−) (A), and IL-17A expression on unstimulated (upper) or PIB-stimulated (lower) PCs, pre-PB, and B cell populations (B). IL-17A gating based on isotype control staining. (C) Bar graph showing IL-17A expression by cell populations shown in (B), depicted as mean frequency + SD (n=3 mice/group). *p < 0.05.
B cell IL-17A is an important driver of allo- and auto- immune responses.
To examine the role of IL-17A produced by B cells on the immune response, we examined EAE in μMT mice after adoptive transfer of WT versus Il-17a−/− B cells. In agreement with previous studies, μMT mice exhibit severe and unremitting EAE induced by MOG35–55 peptide, and this is reduced by the transfer of WT B cells which have been shown to contain Bregs (Figure 3A)15. We reasoned that since WT B cells may not only include Bregs but also IL-17A-producing Beffs, transfer of Il-17a−/− B cells might further reduce EAE severity. Indeed, transfer of Il-17a−/− B cells into μMT mice significantly reduced the severity of EAE well below that seen after transfer of WT B cells.
Fig 3.


IL-17-deficient B cells are regulatory. (A) EAE was induced in μMT mice that received no B cells, or adoptive transfer of 10 ×106 sort-purified B cells from naive WT or IL-17A−/− (B6) mice. Mice were scored daily for clinical EAE severity. Figure shows mean (+ SEM) scores in n ≥6 mice per group. Similar results obtained in a second independent experiment. ***p < 0.001 by 2-way ANOVA. (B) Kaplan–Meier plots showing survival of BALB/c islet allografts in chemically diabetic μMT (B6) recipients that were untreated (control) or received 5×10⁶ syngeneic TIM-4+CD19+ B cells from (day 14) alloimmunized WT or IL-17−/− donor mice. n=4–5 mice/group. *p <0.05; **p <0.01 versus control. (C) Representative flow cytometry plots of IL-10 expression by splenic CD19+ B cells and TIM-4+ B cells obtained from alloimmunized IL-17A−/− versus WT B6 mice IL-10 expression detected by intracellular staining after stimulation with LPIM for 5 hours. (D) Bar graph showing frequency (mean + SD) of IL-10 expression on total (CD19+) B cells and TIM-4+ B cells represented in panel (C). n = 3–5 mice/group. **p < 0.01. (E) BM chimeras were generated by reconstituting lethally irradiated μMT mice with 100% μMT bone marrow or with 80% μMT bone marrow plus 20% IL-17−/−, RORγT−/−, or WT bone marrow cells. Left panel: Bar graph showing IL-17A expression (intracellular staining) in alloimmunized BM chimeras reconstituted with 80% μMT plus either 20% WT or RORγt−/− bone marrow (n=3 mice/group) *p < 0.05. Right panel: Kaplan-Meier plots showing survival of BALB/c islet allografts in chemically diabetic BM chimeric recipients as shown (n=5–10 mice/group) *p < 0.05 vs. Controls. (F-G) BM chimeras generated by reconstituting lethally irradiated μMT mice with 80% μMT plus 20% either IL-17−/− or WT bone marrow (controls) were immunized i.p. with mitomycin C-treated splenocytes from Act-OVA BALB/c × B6 F1 mice followed by adoptive transfer of CFSE-labeled CD90.1+ OT-II CD4+ T cells (5 × 10⁶ per mouse). OT-II cells (CD4+ CD90.1+) in spleens of recipient mice were analyzed by flow cytometry. (F) Proliferation assessed on day 4 by CFSE dilution as shown by representative flow cytometry histograms of OTII cells from BM chimeric mice expressing IL-17−/− vs. WT B cells. Cursor arbitrarily placed to capture % of cells having undergone multiple rounds of proliferation. (G) bar graph showing cytokine and Foxp3 expression (by intracellular staining) expressed as mean +SD on OT-II cells recovered from spleen on day 7. *p < 0.05 and **p<0.01 comparing OT-II cells isolated from IL-17−/− versus WT control BM chimeras. (H) Bar Graph showing frequency of IL-17+ B cells obtained from spleens of Tamoxifen-treated RORγt fl/fl X hCD20.ERT2.Cre+/− (RORγt-iBKO) vs. RORγt fl/fl (Flox Control) mice 14 days after alloimmunization. ** p<0.01. (I) Kaplan-Meier plots of BALB/c islet allograft survival in Tamoxifen-treated chemically diabetic RORγt-iBKO versus Flox Control and hCD20.ERT2.Cre+/− (Cre control) recipients. n=5–8 mice/group *p<0.05. (J) Bar Graph showing the frequency (mean + SD) of IL-10 expression on total B cells and B cell subpopulations (n = 3 mice per group). *p<0.05, **p < 0.01 RORγt-iBKO vs. Flox Control mice.
Similarly, adoptive transfer of Il-17a−/− B cells from alloimmunized B6 mice into chemically diabetic μMT (B6) recipients of BALB/c islets markedly prolonged graft survival, whereas transfer of WT B cells had no effect compared to μMT recipients without B cell transfer (data not shown). To remove the potentially confounding influence of Bregs from the findings, we transferred sort-purified TIM-4+ Beffs from alloimmunized syngeneic (B6) mice into chemically diabetic μMT (B6) islet allograft recipients. As we previously demonstrated, transfer of WT TIM-4+ B cells accelerated islet allograft rejection compared to control μMT recipients without B cell transfer (Figure 3B). Surprisingly, Il-17a −/− TIM-4+ B cells from alloimmunized mice not only failed to accelerate graft rejection, but markedly prolonged graft survival. In attempts to explain the suppressive activity of TIM-4+ B cells from Il-17a −/− mice, we examined their cytokine expression. Compared to WT B cells, those from Il-17a−/− mice produced IL-10 with twice the normal frequency (Figure 3C, D). In particular, IL-10 frequency in TIM-4+ B cells increased 3-fold and was similar to that of TIM-1+ B cells (Figure 1).
To ensure that the effect on B cell IL-10 observed above was not due to dysregulation of B cells arising in globally IL-17A-deficient mice, we generated mixed bone marrow (BM) chimeras where B cells specifically lacked RORγt by reconstituting lethally irradiated μMT hosts with a 1:5 mixture of Rorc−/− and μMT BM. In comparison to control BM chimeras with WT B cells (μMT BM chimeras reconstituted with a 1:5 mixture of WT and μMT marrow), the B cell Rorc−/− BM chimeras produced markedly reduced IL-17A (Figure 3E). Furthermore, in comparison to control BM chimeras, B cell RORγt-deficient BM chimeras exhibit prolonged islet allograft survival and 30% never rejected their allografts (Figure 3E). A similar incidence of long-term allograft survival (33%) was achieved when BM chimeras were generated in μMT BM chimeras reconstituted with a 1:5 mixture of Il17a−/− and μMT bone marrow (Figure 3E).
To determine how IL-17A-deficient B cells altered the antigen-specific T cell response, B cell Il17a−/− BM chimeras vs. WT B cell control BM chimeras were immunized with BALB/c × B6-Act-mOva F1 splenocytes, followed by adoptive transfer of CFSE-labelled OTII CD4+ T cells14,16. The loss of B cell-derived IL-17A was associated with decreased proliferation (day 4), and a 2.5-fold decrease in IL-17A, 2-fold decrease in IFNγ, and ≥1.7-fold increase in IL-10 and IL-4 production by OTII cells (day 7; Figure 3F, G). Similar changes were observed in transferred CD8+ OT-1 cells (Supplementary Figure 4A). Endogenous CD4+ T cells in B cell IL-17A-deficient chimeras exhibited similar reductions in IL-17A and IFNγ, and although IL-10 was not increased, FOXp3+ Tregs were doubled (day 14; Supplementary Figure 4B). These studies suggested that in the absence of Beff-derived IL-17A, T cell proliferation was decreased, and the T cell response was skewed towards a less inflammatory and more regulatory functional repertoire. We next examined endogenous B cells in alloimmunized B cell IL-17A-deficient chimeras. As expected, B cell IL-17A was negligible, and IFNγ was reduced by ~30%, but once again B cell IL-10 was increased more than 2-fold (Supplementary Figure 4B).
To generate a more physiological model we crossed hCD20-ERT2.Cre and Rorcfl/fl mice to generate mice with an inducible knockout of Rorc (encoding RORγt) in B cells (RORγt-iBKO) that are entirely normal until being treated with Tamoxifen (TAM) chow to acutely induce B cell-specific deletion of RORγt. In comparison to TAM-treated Rorcfl/fl mice (Flox controls), B cells from RORγt-iBKO mice exhibited an 80% reduction in B cell IL-17A (Figure 3H). RORγt-iBKO mice exhibited prolongation of islet allograft survival compared to either Flox control or nCD20-ERT2.Cre (Cre control) mice, with ~35% surviving long-term (Figure 3I) - very similar to that seen in the B cell IL-17A deficient BM chimeras above. Furthermore, RORγt-iBKO mice also exhibited decreased EAE severity (Supplementary Figure 4C). A detailed analysis of B cells in alloimmunized mice again demonstrated an overall ~2-fold increase in overall B cell IL-10, and a 5-fold increase in IL-10 production by TIM-4+ B cells (Figure 3J, Supplementary Figure 4D). Similar to the BM chimeras (Supplementary Figure 4B), RORγt-iBKO mice exhibited a 30% increase in frequency of Foxp3+ Tregs (data not shown). Taken together, our findings indicate that even the acute loss of RORγt/IL-17A in developmentally normal mice results in dysregulated IL-10 production in the TIM-4+ Beff subset. Furthermore, the loss of proinflammatory IL-17A and/or increase in IL-10 by B cells is associated with increased allograft survival and decreased EAE severity.
To try to differentiate between the effects of decreased IL-17A and increased IL-10 production by B cells, TAM-treated RORγt-iBKO islet allograft recipients were treated with a blocking anti-IL-10R mAb (clone 1B1.3A)17,18. Anti-IL-10R had no effect on islet allograft survival compared to control rat IgG mAb (Supplementary Figure 5A). To separate the effect of loss of B cell IL-17A from increased IL-10 production, we generated hCD20ERT2.Cre X Rorcfl/fl X Il10fl/fl mice (IL-10/RORγt inducible double KO (iDKO). TAM-treated alloimmunized IL-10/RORγt iDKO B cells exhibited reduced B cell IL-17A expression similar to that seen in RORγt iBKO mice (Supplementary Figure 5B). While B cells from RORγt iBKO mice had elevated IL-10 production (2.5-fold) compared to Cre controls, B cells from IL-10/RORγt iDKO mice exhibited an ~40% decrease in IL-10 production. Despite this reduced B cell IL-10, allograft survival in the B cell IL-17-deficient IL-10/RORγt iDKO mice was significantly greater than Cre control mice (Supplementary Figure 5C). While there was a trend towards decreased survival compared to RORγt iBKO mice, this was not statistically significant. Taken together, these results suggest that loss of RORγt and IL-17A as an inflammatory driver by Beff cells reduces the alloreactive immune response and this is not solely due to increased IL-10.
Regulation of IL-17A and IL-10 expression in B cells by IL-23 and IL-17
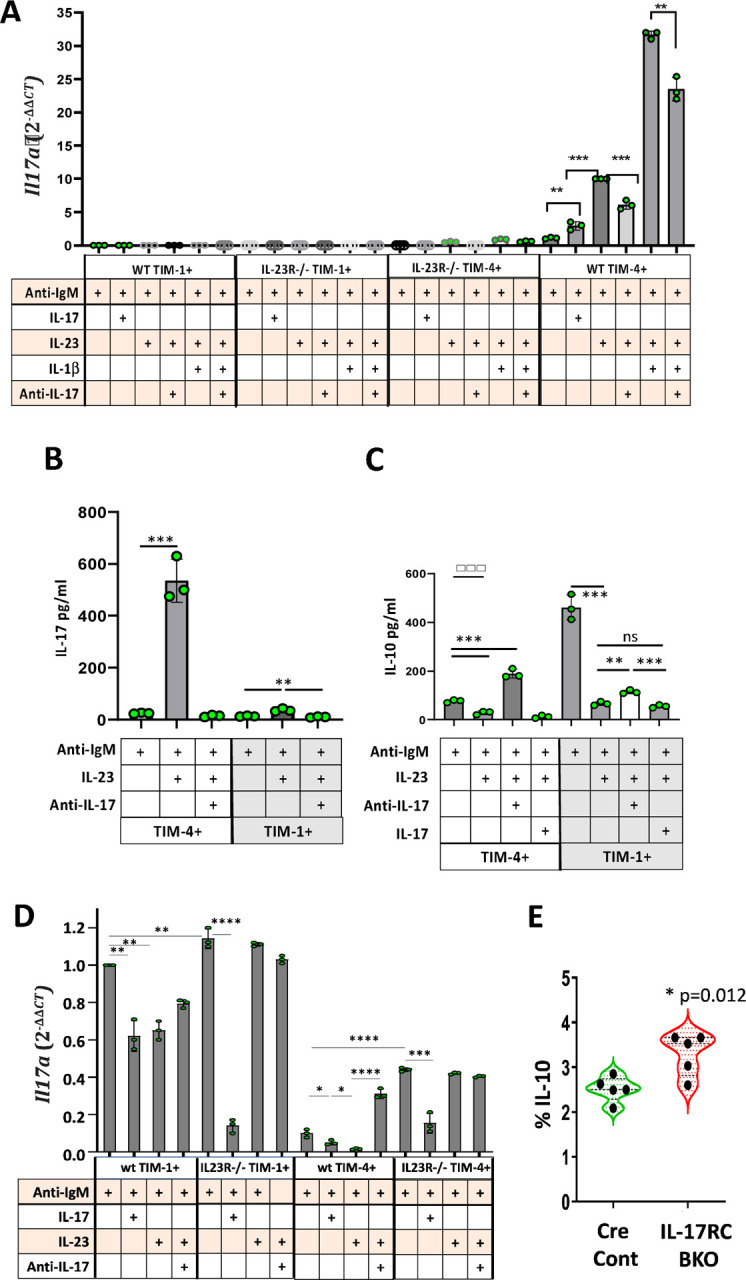
The data above (Figure 1 and Supplementary Figure 2) suggested that IL-17A production by TIM-4+ B cells is IL-23 dependent while deletion of Il17 or Rorc in B cells, augmented IL-10 production. To gain further insight into the regulation of these cytokines, we examined Il17a and Il10 expression at the transcriptional level by performing quantitative PCR (qPCR) on sort-purified TIM-4+(TIM-1−) and TIM-1+(TIM-4−) B cells from WT or IL-23R−/− mice after anti-IgM stimulation with or without additional cytokines for 24 hours. Stimulation of TIM-4+ B cells with anti-IgM induced detectable Il17a mRNA, and this was increased ~3-fold with the addition of IL-17A and ~10-fold with IL-23 (Figure 4A). Consistent with reporter expression (Supplementary Figure 2B), IL-1β augmented Il17a mRNA expression attained with IL-23. Neutralizing anti-IL-17A mAb decreased Il17a mRNA expression induced by either IL-23 alone or IL-23 combined with IL-1β. TIM-4+ B cells from IL-23R−/− mice exhibited markedly reduced Il17a expression, confirming the requirement for IL-23 signaling to induce Il17a expression by TIM-4+ B cells (Figure 4A). In contrast, neither WT nor IL-23R−/− TIM-1+ B cells expressed detectable Il17a mRNA. The mRNA expression data was confirmed at the protein level by comparing IL-17A secretion by sort-purified TIM-1+ versus TIM-4+ B cells in vitro after 48-hour culture (Figure 4B). IL-23 markedly enhances IL-17A secreted by anti-IgM treated TIM-4+ B cells. As expected, anti-IL-17A completely neutralized IL-17A detected in the supernatants. TIM-1+ B cells secrete minimal IL-17A after treatment with IL-23.
Figure 4.
Regulation of IL-17A and IL-10 expression by IL-23 and IL-17.
(A) Splenic TIM-1+TIM-4-CD19+ and TIM-4+TIM-1-CD19+ B cells from IL-23R−/− and WT B6 mice were sort-purified and stimulated in vitro for 24 hours with anti-IgM and different cytokines or neutralizing anti-IL-17A as indicated. PMA and ionomycin was added for the last 3 hours in culture. RNA was extracted and IL-17A expression was compared to that of GAPDH by qPCR for each cell type and condition. The bar graph shows the relative expression of IL-17A mRNA as 2-ΔΔCT performed in triplicate wells on cells pooled from 3 mice per group. **p<0.01 and ***p<0.001. Data representative of three independent experiments.
(B-C) Sort-purified TIM-1+TIM-4-CD19+ and TIM-4+TIM-1-CD19+ B cells from spleens of WT B6 mice were stimulated in vitro with anti-IgM alone or anti-IgM plus IL-23, IL-17A or anti-IL-17A neutralizing antibody for 48 hours. Bar graphs display the concentration of IL-17A (B) and IL-10 (C) in the supernatants, as measured by cytometric bead array (performed in triplicate wells on cells pooled from 3 mice per group). Data representative of three independent experiments. **p<0.01 and ***p<0.001.
(D) Splenic TIM-1+TIM-4-CD19+ and TIM-4+TIM-1-CD19+ B cells were sort-purified from IL-23R−/− and WT B6 mice and stimulated in vitro as in (A) above. IL-10 mRNA expression was compared to that of GAPDH by qPCR. The bar graph shows the relative expression of IL-10 as 2-ΔΔCT performed in triplicate wells on cells pooled from 3 mice per group. **p<0.01 and ***p<0.001. Data representative of three independent experiments. (E) Violin plot depicting the frequency (mean + SD) of IL-10 expression (intracellular staining) on splenic CD19+ B cells from IL-17RCfl/fl-CD19-Cre+/− (IL-17RC-BKO) and CD19-Cre (Cre Control) mice 14 days after alloimmunization and in vitro treatment with LPIM for 5 hours. n=5 mice. *p<0.05.
Our data (Figure 3 and Supplementary Figure 4) indicates that deletion of either RORγt or IL-17A expression by B cells increases IL-10 production by TIM-4+ B cells. This suggests that B cell IL-17A may directly or indirectly inhibit IL-10 production by TIM-4+ B cells and maintain their Beff function. To address this, we examined IL-10 secretion by sort-purified TIM-4+ versus TIM-1+ B cells in vitro. Anti-IgM-stimulated TIM-4+ B cells secrete only 1/6 as much IL-10 as TIM-1+ B cells (Figure 4C), in agreement with the frequency of IL-10 expression determined by intracellular staining (Figure 1). The addition of IL-23, which promotes IL-17A secretion, to TIM-4+ B cells inhibits IL-10 secretion ~3-fold. However, when IL-17A in the supernatant is neutralized with anti-IL-17A, anti-IgM plus IL-23-stimulated TIM-4+ B cells increase their IL-10 secretion almost 8-fold (~2.5-fold above the baseline with anti-IgM alone; Figure 4C). In contrast, IL-10 secretion after anti-IgM plus IL-23 treatment is further reduced by the addition of exogenous IL-17A. This suggests that IL-17A directly inhibits IL-10 production by TIM-4+ B cells. As noted above, TIM-1+ B cells secrete higher levels of IL-10 in response to anti-IgM than TIM-4+ B cells, and IL-10 production is markedly inhibited by IL-23. While the addition of IL-23 does induce detectable IL-17A secretion by TIM-1+ B cells (Figure 4B), this is unlikely to be the main mechanism by which IL-23 inhibits IL-10 production in TIM-1+ B cells since IL-17A neutralization only slightly restores IL-10, and addition of exogenous IL-17A has no significant effect on IL-10 secretion compared to IL-23 alone. IL-23 does signal in both TIM-1+ and TIM-4+ B cells and inhibits IL-10 secretion, as it does in pathogenic Th17 cells19. However, whereas the inhibition of IL-10 by IL-23 signaling can be overcome by IL-17A neutralization in TIM-4+ B cells, IL-23-mediated suppression of IL-10 in TIM-1+ B cells appears largely independent of IL-17A.
Examination of Il10 mRNA by qPCR generally corroborates cytokine secretion data (Figure 4D). WT TIM-4+ B cells expressed low levels of IL-10 mRNA, and this was reduced by the addition of IL-17A and even more so after the addition of IL-23. However, Il10 mRNA was increased many-fold by neutralizing IL-17A despite the presence of IL-23. As shown in Figure 4A, IL-23R−/− TIM-4+ B cells expressed much less (undetectable) IL-17A than WT TIM-4+ B cells, but they expressed significantly more IL-10 (Figure 4D). Addition of exogenous IL-17A reduced IL-10 expression in IL-23R−/− TIM-4+ B cells demonstrating an IL-23-independent effect of IL-17. WT and IL-23R−/− TIM-1+ B cells express significantly more Il10 than TIM-4+ B cells. In the absence of IL-23 signaling, IL-17A independently inhibits Il10 expression by TIM-1+ B cells. Taken together, these data suggest that IL-17A acts directly on B cells to suppress Il10 expression. Figure 3D further shows that B cells from BM chimeras specifically lacking B cell-derived IL-17 exhibit increased IL-10 production, suggesting that IL-17A acts as an autocrine factor to suppress B cell IL-10.
If IL-17A has a direct effect on B cell Il10 expression, IL-17R-deficient B cells should express more Il10. To test this, we generated Il17RCfl/fl X CD19-Cre (IL-17RC BKO) mice and compared these to CD19-Cre controls. Consistent with our hypothesis, B cells from immunized IL-17RC BKO mice produced over 40% more IL-10 than Cre control B cells (Figure 4E).
TIM-4+B cells express multiple pro-inflammatory cytokines with a pattern resembling pathogenic Th17 cells.
The production of both IFNγ and IL-17A raised the question as to whether TIM-4+ B cells also express other pro-inflammatory cytokines, opposite to the anti-inflammatory profile of TIM-1+ B cells. To address this, we performed population level transcriptomic sequencing (RNA-seq) on RNA isolated from highly sort-purified TIM-4+(TIM-1−), TIM-1+(TIM-4−), and TIM-4−TIM-1− (DN) B cells from spleens of alloimmunized mice, after stimulation for 24 hours with anti-IgM plus IL-23. This allowed us to compare TIM-4+ Beffs and TIM-1+ Bregs, separately from the majority population of DN B cells which express little IL-17, IFNγ, or IL-10 (Figure 1 and9).
We performed principal component analysis (PCA) and observed that PC1 separated the expression profiles of TIM-1+ and TIM-4+ B cells, while PC2 separated DN B cells from both TIM-4+ and TIM-1+ B cells (Supplementary Figure 6A). TIM-1+ samples from different mice showed more variability along PC1 because of differences in the total number of unique genes detected. All samples were included in the subsequent analysis as no one sample failed quality control. Comparison of TIM-4+ and TIM-1+ cells by differential gene expression analysis revealed 3425 upregulated genes (613 with fold change >1.5) and 7858 downregulated genes (7393 with fold change >1.5) (FDR <0.05 Figure 5A) in the TIM-4+ population. Genes of interest are displayed in the volcano plot (Figure 5B). Compared to TIM-1+ B cells, TIM-4+ B cells not only expressed higher levels of Il17a, but also of Il17f, Il22, Csf2, Il6, Il1β, TNFα, and Il2 (Figure 5B–D), thus constituting a pro-inflammatory module. As expected, TIM-1+ cells expressed more Il10, and also Ctla4, Nte5 (expressing CD73), ENTpd1 (expressing CD39), Cd274 (expressing PD-L1), and Pdcd1lg2 (expressing PD-L2). Of note, Ifng expression, showed a trend, but was not statistically higher in TIM-4+ B cells (Figure 5C), even though IFNγ protein expression is higher in TIM-4+ versus TIM-1+ B cells in the absence of stimulation with IL-239. Surprisingly, in these stimulated cells, the TIM-4 gene (Timd4) was expressed at higher levels by TIM-1+ B cells even though TIM-4 protein was not detected by flow cytometry. Many of the same proinflammatory cytokines noted above were also increased in TIM-4+ B cells compared to DN B cells (Figure 5C, D). Comparison of the overall gene expression profile of TIM-4+ versus DN cells revealed 197 upregulated genes and 1 downregulated gene (Pcdhga10, protocadherin gamma subfamily A, 10) at fold change >1.5 (not shown). A second independent experiment comparing TIM-4+ vs TIM-4− B cells gave similar results (data not shown). The top 50 upregulated and downregulated genes in TIM-4+ vs TIM-1+ B cells are listed in Supplementary Table 1.
Figure 5.

Differential gene expression in TIM-1+ and TIM-4+ B cells from alloimmunized mice. A-B: Amongst genes of interest, pro-inflammatory genes are depicted in red, anti-inflammatory genes are in blue, and other genes are in black text. A) Heatmap showing differentially expressed genes identified by RNA-seq (FDR<0.05). B) Volcano plot with selected genes of interest. The y-axis is capped at 25 for visual clarity. C) Heatmap comparing expression of selected genes of interest between three groups: TIM-1+, TIM-4+ and DN B cells annotated on the right. Vertical bars represent genes that are upregulated (orange), downregulated (black), or not statistically differentially expressed (gray, FDR ≥ 0.05) in a given comparison between TIM-4+ B cells (T4) and either TIM-1+ (T1) or DN B cells. D) Fold change in expression between select genes in TIM-4+ vs. TIM-1+ B cells or TIM-4+ vs. all other (TIM-4−) B cells.
The pattern of cytokine genes expressed by TIM-4+ B cells closely resembles that of pathogenic Th17 cells (pTh17)21–23. Comparing gene expression by TIM-4+ B cells to those of TIM-1+ B cells, demonstrates that in addition to the cytokines pathognomonic for pTh17 cells like Csf2 and Il22, TIM-4+ B cells exhibit increased expression of a number of other genes in the pTh17 signature that we identified by polarizing pTh17 cells with TGFβ3 and IL-6, compared to non-pTh17 cells polarized with TGFβ1 and IL-6 (Supplementary Figure 6B)22. These include chemokines such as Ccl3, Ccl4, and Ccl5, as well as Stat4, and Lgals3 (encoding Galectin 3). However, not all genes upregulated in that pTh17 signature were upregulated in TIM-4+ versus TIM-1+ B cells. These include Icos, Cxcl3, Gzmb, Casp1 (encoding caspase I, required for IL-1β maturation) and Tbx21 (expression variably increased in TIM-4+ B cells). Amongst genes downregulated in pTh17 cells, Il10, Maf, and Ikzf3 (IKAROS family Zinc Finger 3) are also downregulated in TIM-4+ B cells, while Cd5l was upregulated and Ahr expression was variable in TIM-4+ B cells (Supplementary Figure 6C). Of genes identified in several other pTh17 signatures23–28, only Batf, Bhle40, and Cd44 were upregulated in TIM-4+ B cells, but not Il23r, the canonical Notch signaling mediator Rbpj, IL1rn, Gpr65, Toso, Plzp, Batf3, Cd44, Prdm1, Protein receptor C (PROCR), Foxo1, or IRF4, (Supplementary Figure 6B) This suggests that despite their similarities in cytokine expression, the regulation of TIM-4+ B cell induction or differentiation may be distinct from that of pTh17 cells22,24–28.
DISCUSSION:
In addition to antibody production, B cells play an important role in enhancing or inhibiting immune responses through antigen presentation, the elaboration of cytokines and expression of coinhibitory and costimulatory ligands1–5. Despite the strong influence of B cells producing various proinflammatory cytokines on microbial immunity, tumor immunity, alloimmunity, and autoimmunity, no broad marker for Beffs has been previously identified. In this study, we demonstrate that TIM-4 identifies proinflammatory Beff cells that preferentially produce IL-17A and other proinflammatory cytokines resembling those expressed by pTh17 cells. Production of proinflammatory cytokines by TIM-4+ B cells is dependent on IL-23 and RORγt, and critically, IL-17, which is required as an autocrine factor. In the absence of these underlying pro-inflammatory signals TIM-4+ B cells are dysregulated and now produce IL-10 and exhibit potent regulatory activity.
In humans, B cell depletion can lead to rapid improvement in autoimmune disease without a reduction in auto-Ab levels (rheumatoid arthritis) or oligoclonal bands in the cerebral spinal fluid (multiple sclerosis)29–31. In multiple sclerosis, B cells produce high levels of proinflammatory cytokines like TNF and GM-CSF and decreased IL-1032,33. B cell depletion with anti-CD20, now a first-line treatment in relapsing MS, results in repopulation by B cells producing normalized ratios of pro- versus anti- inflammatory cytokines, and this correlates with reduced T cell hyperreactivity32. These studies indicate that B cells can play an important effector role, enhancing inflammatory immune responses. However, in kidney and heart transplant patients, where B cells appear to have a more normal cytokine distribution, B cell depletion in the peri-transplant period actually augments allograft rejection, suggesting a requisite regulatory role for B cells34,35. Further, the ratio of IL-10/TNF production by transitional B cells 3 months after transplantation, thought to reflect the relative balance of Bregs and Beffs, is highly predictive of future allograft rejection and 5-year allograft survival6.
Until recently, our understanding of Breg biology was hampered by the lack a unifying marker. The discovery of TIM-1 as a broad functional marker was an important step forward8. TIM-1 regulates the expression of an array of anti-inflammatory cytokines and coinhibitory molecules and its specific deletion in B cells results in spontaneous systemic autoimmunity, including an EAE-like paralytic neuroinflammatory disorder7. In contrast, B cells producing various proinflammatory cytokines have been shown to play an important role in immune responsiveness. For example, B cell production of IFNγ plays a requisite role in proteoglycan-induced arthritis, TNFα and IL-2 in clearance of H. polygyrus, and IL-6 in EAE severity2,4,5. Yet no broad marker for Beffs has been previously identified. We previously showed that TIM-4+ B cells were proinflammatory, enhancing both tumor and allograft rejection9. This was initially attributed to their increased expression of IFNγ. We now show that TIM-4 identifies B cells that not only express IL-17A but also IL-17F, IL-22, IL-6, and GM-CSF - a pattern that closely resembles cytokines expressed by pTh17 cells. Thus, TIM-4+ B cells express many of the proinflammatory cytokines previously attributed to B cell effector function. This allows us to begin to address how proinflammatory cytokine production is regulated in TIM-4+ Beffs and differs from the signals regulating TIM-1+ Breg activity.
Bermejo et al previously reported that in the setting of T. cruzii infection, a pathogen-specific transialidase alters CD45 glycosylation and this induces B cell IL-17A expression in a RORγt independent manner13. Whereas adoptive transfer of WT B cells into μMT mice enhanced clearance of T. cruzii, IL-17−/− B cells had no effect. We now demonstrate that B cell IL-17A expression is a much more generalized component of B cell function, expressed in response to various types of immunization at a frequency similar to that of IL-10 expression in B cells. IL-17A is predominantly produced by TIM-4+ B cells, and in these settings, IL-17A production is RORγt dependent. Plasma cells and pre-plasmablasts (B220+ CD138hi) spontaneously produce IL-17A at relatively high frequency and contribute roughly half of all the IL-17 produced by the B cell lineage. However, after in vitro stimulation, the frequency of B cells expressing IL-17A increases several-fold and outweighs the contribution by the small plasma cell subset. This closely parallels IL-10, which is spontaneously produced by plasma cells and significantly induced by in B cells after vitro stimulation14.
In the absence of B cell-derived IL-17A or RORγt, we showed that TIM-4+ B cells are dysregulated and significantly upregulate IL-10 and exhibit potent regulatory activity. Conversion between B cells with regulatory versus pro-inflammatory activity has not been previously described. This Breg activity is associated with decreased CD4 and CD8 proliferation, increased Tregs, and decreased Th17 and Th1 responses, resulting in reduced EAE severity and prolonged allograft survival. However, results using mice floxed for both RORγt and IL-10, indicate that increased IL-10 does not solely explain the regulatory activity of these dysregulated TIM-4+ B cells. This suggests that B cells lacking IL-17 or RORγt either fail to drive inflammatory T cell responses, or express additional regulatory molecules, which results in the decreased proinflammatory and increased regulatory T cell responses observed.
Non-pathogenic Th17 (npTh17) cells express IL-10 along with IL-17A, and while not frankly suppressive, they play an essential role in the integrity of the gut mucosal barrier36,37. In contrast, pTh17 cells express little IL-10, but express IL-17A in conjunction with a host of other pro-inflammatory cytokines including, for example, GM-CSF which plays an important inflammatory role in EAE37,38. The equilibrium between npTh17 and pTh17 cells is carefully regulated by balancing IL-10 and IL-23R expression, respectively. For example, npTh17 cells express increased Cd5l, which binds to fatty acid synthase and leads to increased intracellular polyunsaturated versus saturated fatty acids, reducing RORγt agonistic ligands19. This results in increased RORγt binding and transactivation of the Il10 locus and reduced RORγt binding to the Il23r locus, which together, promote the differentiation of npTh17 rather than pTh17 cells. In contrast, increased RBPJ, a mediator of NOTCH signaling, enhances IL-23R expression which drives pTh17 differentiation39.
IL-23 is an important driver of the TIM-4+ pro-inflammatory module which shares many similarities to that of pTh17 cells including cytokines, chemokines (Ccl3, Ccl4, Ccl5), Lgals3 (encoding Galectin3), and Stat422. Despite this resemblance, regulation of proinflammatory cytokine versus IL-10 expression within the TIM-4+ Beff population and between TIM-4+ Beffs and their opposing TIM-1+ Breg subset, differs from that in npTh17 and pTh17 cells. Compared to TIM-1+ Bregs, TIM-4+ B cells express increased Cd5l, which as noted above, is generally expressed in npTh17 cells, promotes IL-10 induction, and inhibits their development of proinflammatory function. Yet, TIM-4+ B cells express little Il10 and are highly pro-inflammatory. Moreover, neither RBPJ nor IL-23R are differentially expressed, consistent with IL-23 responsiveness by both TIM-1 and TIM-4+ B cells. Indeed, IL-23R signaling reduces Il10 expression in both TIM-1+ and TIM-4+ B cells. However, IL-23 induces inflammatory cytokine expression in TIM-4+, but not in TIM-1+, B cells. Thus, TIM-1+ and TIM-4+ B cells exhibit distinct signals through the IL-23R that differentially regulate proinflammatory cytokine loci. Further study will be necessary to elucidate these signals. Of note, TIM-4+ B cells do differentially express Bhle40, a basic helix-loop-helix transcription factor that promotes Csf2 and inhibits Il10 expression in pTh17 cells, and BatF, an AP-1 transcription factor that binds to the Il17, Il21 and Il22 promoters17,40.
We have shown that BM chimeric mice with a B cell-specific deletion of Il17a and mice with an inducible deletion of Rorc exhibit a significant increase in IL-10 production by TIM-4+ B cells, and that IL-17A directly inhibits IL-10 production by TIM-4+ B cells in vitro. This suggests that IL-17A may directly act on TIM-4+ B cells to inhibit IL-10 production in an autocrine fashion. IL-23 also inhibits IL-10 expression by TIM-4+ B cells, but this is fully reversible by neutralizing IL-17. One possible mechanism is that in TIM-4+ B cells, IL-23 inhibits Il10 expression indirectly through IL-17A. To our knowledge, a pathway leading from IL-17A signaling to IL-10 inhibition has not been previously described and will require further study. This pathway does not predominate in TIM-1+ B cells where IL-23 signals inhibit IL-10 despite barely detectable IL-17A expression, and only modest recovery of IL-10 expression occurs upon IL-17A neutralization. Addition of exogenous IL-17 does not suppress IL-10 expression by TIM-1+ B cells beyond that seen with IL-23 alone. However, in the absence of IL-23R signaling, exogenous IL-17 does inhibit Il10 mRNA expression by TIM-1+ B cells (Fig 4D), suggesting that IL-17 and IL-23 independently inhibit Il10 expression.
Taken together, our data suggest that in TIM-4+ B cells, IL-23 drives the expression of a proinflammatory module which includes RORγt-dependent IL-17A production. IL-17A acts in an autocrine manner to potently suppress Il10 expression and enforce pro-inflammatory Beff activity. In contrast, IL-23 has minimal effect on proinflammatory cytokine expression by TIM-1+ B cells, while IL-23 and IL-17 appear to independently inhibit Il10 expression. These findings suggest that cross-regulation may occur at several levels. IL-23 in the microenvironment should inhibit Il10 expression by TIM-1+ B cells and augment expression of the TIM-4+ proinflammatory module. IL-17 expressed by TIM-4+ B cells not only enforces their Beff activity but may suppress Il10 expression by TIM-1+ Bregs. Finally, impairment of IL-17 expression by TIM-4+ Beffs would result in their increased Il10 expression and Breg activity. Thus, we have identified a reciprocal relationship between B cells with regulatory and effector activity. In this regard, we recently showed that deletion of TIM-1 expression in B cells inhibits tumor progression and results in the expansion of B cells in the draining LNs that express proinflammatory cytokines in a type I IFN-mediated manner41. Whether this is due to the acquisition of inflammatory function by B cells that were destined to become TIM-1+ Bregs, or due to increased TIM-4+ Beffs in the absence of TIM-1+ Bregs, is not yet clear. In conclusion, TIM-1+ and TIM-4+ B cells exhibit different signals through the IL-23R that differentially regulate IL-10 and proinflammatory phenotype and Beff versus Breg function. Further elucidation of these signals may allow therapeutic manipulation of these two B cell subsets to enhance or inhibit the immune response in autoimmunity and alloimmunity versus cancer.
METHODS:
Mice:
C57BL/6 (B6; H-2b), BALB/c (H-2d), RORγt−/−, RORγtfl/fl, IL-10fl/fl, Il17a–/–, Blimp1-eYFP, B6 IL-17A–EGFP reporter, OT-I transgenic, OT-II transgenic and μMT (B6) mice were from The Jackson Laboratory. hCD20-ERT2.Cre were from Mark J Shlomchik, University of Pittsburgh42. RORγtfl/fl hCD20CRE+/− (RORγt iBKO) mice were generated in our facility by crossing RORγtfl/fl mice to hCD20-ERT2.Cre mice. F1.Act-mOVA mice (provided by Fadi Lakkis, University of Pittsburgh) were generated by breeding BALB/c mice with B6.Act-OVA mice16. RORγtfl/flIL-10fl/flhCD20.ERT2.Cre+/− (IL-10/RORγt iB-DKO) were generated by interbreeding RORγtfl/fl and IL-10fl/fl mice and then crossing with hCD20-ERT2.CRE RORγtfl/fl mice. All animals were used at 6–10 weeks of age and were housed with food and water ad libitum.
Islet isolation, transplantation, and alloantigen immunization:
Allogeneic islets from B6 donors were digested with collagenase V (Sigma-Aldrich), purified by filtration through a 100-μm nylon cell strainer (BD Biosciences), hand-picked under a stereomicroscope, and placed under the left renal capsule of sex-matched allogeneic recipients with streptozotocin-induced diabetes (400 islets per recipient), as we previously described8,9. All recipients had glycemia < 150 mg/dl within 2 d after transplant. Blood glucose > 250 mg/dl for two consecutive days after engraftment was defined as rejection8,9. In some experiments, mice were immunized with alloantigen by i.p. injection of 2 × 10⁷ mitomycin C–treated allogeneic (BALB/c) splenocytes, as described8,9.
Flow cytometry:
Fluorochrome-conjugated mAbs were purchased from BD Biosciences, eBioscience, and BioLegend). All staining was performed in the presence of Fc block(anti-CD16/CD32) and LIVE/DEAD Fixable Aqua viability indicator. Flow acquisition was performed on LSRII analyzers (BD Biosciences), and data were analyzed using FlowJo software (BD). Background staining was determined with isotype-matched controls. Where IL-17A was detected by EGFP reporter expression, cells from WT (GFP-) littermates were used as negative controls. For detection of intracellular cytokines, T cells were cultured for 4 hours with PMA (50 ng/ml; Sigma-Aldrich), ionomycin (500 ng/ml; Sigma-Aldrich), and GolgiPlug (1 μl/ml; BD Biosciences). For detection of B-cell IL-10, B cells were cultured for 5 hours with LPS (10 μg/ml), PMA (50 ng/ml; Sigma-Aldrich), ionomycin (500 ng/ml; Sigma-Aldrich), and monensin (1 μl/ml; eBiosciences), as described previously8,9. For detection of B-cell IL-17, B cells were cultured as above, except Brefeldin A (1 μl/ml; eBiosciences) was substituted with Monensin. Intracellular cytokine staining was conducted after permeabilization using intracellular staining kits from BD Biosciences or eBioscience.
Cell preparation and adoptive transfer:
B cells subsets were obtained from WT or IL17−/− naïve mice or from mice 14 d after alloantigen immunization (2 × 10⁷ mitomycin C–treated BALB/c splenocytes i.p.) by negative selection (EasySep; StemCell Technologies). Purity of the B cell subset was greater than 98%. CD19+TIM-4+and CD19+ TIM-4– B cells were subsequently isolated by FACS using BD FACSAria (>95% purity). For adoptive transfer studies, 5–7 × 10⁶ purified B cell subsets from syngeneic mice were injected i.v. into otherwise untreated μMT allograft recipients or EAE recipients. In transplant experiments, CD19+ cells above were obtained from B6 mice immunized with alloantigen (as above).
RNA isolation, real-time PCR:
Total RNA was purified from cells by using RNeasy Micro Kit (Qiagen). 100ng of total RNA was used for cDNA synthesis by RNA to cDNA EcoDry™ Premix (Double Primed) kit (Takara), and qPCR was performed by Taqman primers with TaqMan™ Fast Advanced Master Mix (Applied Biosystems™) on StepOnePlus Real-Time PCR Systems (Applied Biosystems). Relative expression quantification was calculated using the ΔΔCt method and level was normalized by GAPDH. Taqman primers and probes were purchased from Applied Biosystems: Mm00439618_m1 (IL-17A), Mm01288386_m1(IL-10), Hs02786624_g1(GAPDH).
EAE:
Mice were immunized subcutaneously in the flank with an emulsion containing MOG 35–55 (200μg/mouse) and CFA (200 μl/mouse; Difco Laboratories, containing M. tuberculosis H37Ra, 5 mg/ml). Pertussis toxin (200 ng/mouse; List Biological Laboratories) was administered intraperitoneally on days 0 and 2. Mice were monitored and assigned grades for clinical signs of EAE. Mice were observed for signs of EAE beginning on day 7 after immunization. Mice were clinically assessed with daily assignment of scores on a standard 0–5 scale as follows: no clinical expression of disease, 0; partially limp tail, 0.5; completely limp tail, 1; limp tail and waddling gait, 1.5; paralysis of one hind limb, 2; paralysis of one hind limb and partial paralysis of the other hind limb, 2.5; complete paralysis of both hind limbs, 3; ascending paralysis, 3.5; paralysis of trunk, 4; moribund, 4.5; death, 5. To evaluate the suppressive ability of IL-17A−/− B cells, purified total IL-17A−/− B cells, B cells were transferred i.v. into μMT recipients. Hosts were then immunized to induce EAE.
Generation of bone marrow (BM) chimeric mice:
μMT mice were lethally irradiated (1000 rad) and reconstituted with a combination of syngeneic (H-2b) BM cells (107) from μMT and WT donors (80:20 ratio) or from μMT and IL-17A−/− (80:20 ratio) or from μMT and RORγT−/− (80:20 ratio) donors. BM chimeras were used after 8 weeks to allow immune reconstitution. B cells were fully reconstituted (from non-μMT bone marrow).
Cytometric Bead Array (CBA):
IL-17A and IL-10 in supernatant were quantified simultaneously using a BD™ Mouse Cytokine Cytometric Bead Array (CBA) kit and BD™ CBA FCAP array software (BD Biosciences, San Jose, CA, USA), following the manufacturer’s instructions. The BD™ LSR II system (Becton Dickinson) was calibrated with set-up beads, and 3000 events were acquired for each sample. Individual cytokine concentration ratios were indicated by their fluorescent intensities.
Purification and adoptive transfer of TCR-transgenic T cells:
CD4 and CD8 T cells from spleens and lymph nodes of OT-II transgenic mice and OT-I transgenic mice were purified using EasySep™ Mouse CD4+ T Cells and CD8 T cells Isolation Kit (STEMCELL), respectively, and were labeled with CFSE (ThermoFisher) and were injected i.v. at 2 × 10⁶ cells per B-cell IL-17−/− recipient BM chimeric mice. Mice were immunized the following day with splenocytes from F1.Act-mOVA mice. 4 days after priming, some recipients were sacrificed and proliferation for their OT cells were analyzed by flow cytometry. The remaining mice were sacrificed at 7 days after priming, cytokines expression for transferred OT cells were analyzed by intracellular staining using flow cytometry.
RNA-seq:
CD19 B cells were purified from splenocytes of alloimmunized B6 mice EasySep™ Mouse Pan-B Cell Isolation Kit (STEMCELL), purity >98%. Purified B cells were stained with anti-CD19, TIM-1, TIM-4, DUMP (CD3, CD64, Gr-1, Ter119) and subjected to FACS for CD19+ TIM-1+TIM-4−, TIM-4+TIM-1− and DN populations. Sorting repeated 2–3X for each population until the subset purity was ~100%. Total RNA was the purified from cells by using RNeasy Micro Kit (Qiagen) and checked for purity and integrity in a Bioanalyzer-2100 (Agilent Technologies, Inc., Santa Clara, CA) and submitted to the University of Pittsburgh Health Sciences Sequencing Core at Children’s Hospital for sequencing. Libraries were prepared using the Ultra-low input RNA-seq Preparation Kit (Takara) as recommended by the manufacturer. Each library was paired end sequenced (2 × 75 bp) using Illumina/NextSeq. Sequencing using NextSeq Fastq files were returned by the core for further analysis.
Processing and analysis of bulk RNA-seq data:
Bulk RNA-seq data were preprocessed on the Google Cloud Platform via the Terra scientific computing platform (Terra.Bio). Briefly, raw reads were aligned to the mouse genome mm10 using the STAR (v2.7.5a)43 alignment tool. Duplicate reads were identified using Picard MarkDuplicates44. RNA-SeQC 245 was used for assessing sequencing depth and mapping quality. Raw counts and transcript per million (TPM) estimates were quantified using RSEM46.
All downstream analyses were carried out in R (v4.1.3). Principal Component Analysis (PCA) was conducted using the R function prcomp. The gene with the highest PC2 loading, AY036118, was removed since it represents ribosomal RNA contamination20. Differential gene expression analysis was performed using DESeq2 (v1.32.0)47. Lowly expressed genes with a total count lower than 10 were prefiltered. P-values were adjusted by Benjamini-Hochberg (BH) method48, and log2 fold changes were shrunk using the ‘apeglm’ algorithm49. These shrunken fold changes are also depicted in all figures.
Heatmaps were created using R package ComplexHeatmap (v2.13.1)50 on normalized counts (normalized using the counts function from the BiocGenerics package (v0.40.0)51) and were scaled by row. Volcano plots were generated using ggplot2 (v3.4.2)52 and ggrepel (v0.9.3).
Statistics.
Statistical analyses of allograft survival used log-rank (Mantel-Cox) test. Differences were considered to be significant at P values less than 0.05. The clinical score and incidence of EAE were analyzed by 2-way Anova, and comparisons for results (mean ± SEM) for cytometric bead array. FACS, and real-time PCR were analyzed by Student’s t test and p <0.05 was considered significant. Significantly differentially expressed genes for RNA-seq analysis were identified using DESeq2 with Benjamini-Hochberg adjusted p-value < 0.05.
Study approval:
Animal studies were approved by the Institutional Animal Care and Use Committee at the University of Pittsburgh (Pittsburgh, PA, USA).
Supplementary Material
Acknowledgements
We would like to thank Dr. Mark Shlomchik for supplying the hCD20.ERT2.Cre mice. This research was supported PO1 AI129880
References:
- 1.Lund F.E., and Randall T.D. (2010). Effector and regulatory B cells: modulators of CD4+ T cell immunity. Nature reviews. Immunology 10, 236–247. 10.1038/nri2729. [DOI] [PMC free article] [PubMed] [Google Scholar]
- 2.Lino A.C., Dorner T., Bar-Or A., and Fillatreau S. (2016). Cytokine-producing B cells: a translational view on their roles in human and mouse autoimmune diseases. Immunological reviews 269, 130–144. 10.1111/imr.12374. [DOI] [PubMed] [Google Scholar]
- 3.Mauri C., and Menon M. (2015). The expanding family of regulatory B cells. International immunology 27, 479–486. 10.1093/intimm/dxv038. [DOI] [PMC free article] [PubMed] [Google Scholar]
- 4.Fillatreau S. (2015). Pathogenic functions of B cells in autoimmune diseases: IFN-gamma production joins the criminal gang. European journal of immunology 45, 966–970. 10.1002/eji.201545544. [DOI] [PubMed] [Google Scholar]
- 5.Cherukuri A., Ding Q., Sharma A., Mohib K., and Rothstein D.M. (2019). Regulatory and Effector B Cells: A New Path Toward Biomarkers and Therapeutic Targets to Improve Transplant Outcomes? Clin Lab Med 39, 15–29. 10.1016/j.cll.2018.10.011. [DOI] [PMC free article] [PubMed] [Google Scholar]
- 6.Cherukuri A., Mohib K., and Rothstein D.M. (2021). Regulatory B cells: TIM-1, transplant tolerance, and rejection. Immunol Rev 299, 31–44. 10.1111/imr.12933. [DOI] [PMC free article] [PubMed] [Google Scholar]
- 7.Xiao S., Bod L., Pochet N., Kota S.B., Hu D., Madi A., Kilpatrick J., Shi J., Ho A., Zhang H., et al. (2020). Checkpoint Receptor TIGIT Expressed on Tim-1(+) B Cells Regulates Tissue Inflammation. Cell Rep 32, 107892. 10.1016/j.celrep.2020.107892. [DOI] [PMC free article] [PubMed] [Google Scholar]
- 8.Ding Q., Yeung M., Camirand G., Zeng Q., Akiba H., Yagita H., Chalasani G., Sayegh M.H., Najafian N., and Rothstein D.M. (2011). Regulatory B cells are identified by expression of TIM-1 and can be induced through TIM-1 ligation to promote tolerance in mice. The Journal of clinical investigation 121, 3645–3656. 10.1172/JCI46274. [DOI] [PMC free article] [PubMed] [Google Scholar]
- 9.Ding Q., Mohib K., Kuchroo V., and Rothstein D. (2017). TIM-4 Identifies IFN-gamma-Expressing Proinflammatory B Effector 1 Cells That Promote Tumor and Allograft Rejection. Journal of immunology 199, 2585–2595. [DOI] [PMC free article] [PubMed] [Google Scholar]
- 10.Wojciechowski W., Harris D.P., Sprague F., Mousseau B., Makris M., Kusser K., Honjo T., Mohrs K., Mohrs M., Randall T., and Lund F.E. (2009). Cytokine-producing effector B cells regulate type 2 immunity to H. polygyrus. Immunity 30, 421–433. 10.1016/j.immuni.2009.01.006. [DOI] [PMC free article] [PubMed] [Google Scholar]
- 11.Barr T.A., Shen P., Brown S., Lampropoulou V., Roch T., Lawrie S., Fan B., O’Connor R.A., Anderton S.M., Bar-Or A., et al. (2012). B cell depletion therapy ameliorates autoimmune disease through ablation of IL-6-producing B cells. The Journal of experimental medicine 209, 1001–1010. 10.1084/jem.20111675. [DOI] [PMC free article] [PubMed] [Google Scholar]
- 12.Olalekan S.A., Cao Y., Hamel K.M., and Finnegan A. (2015). B cells expressing IFN-gamma suppress Treg-cell differentiation and promote autoimmune experimental arthritis. European journal of immunology 45, 988–998. 10.1002/eji.201445036. [DOI] [PMC free article] [PubMed] [Google Scholar]
- 13.Bermejo D.A., Jackson S.W., Gorosito-Serran M., Acosta-Rodriguez E.V., Amezcua-Vesely M.C., Sather B.D., Singh A.K., Khim S., Mucci J., Liggitt D., et al. (2013). Trypanosoma cruzi trans-sialidase initiates a program independent of the transcription factors RORgammat and Ahr that leads to IL-17 production by activated B cells. Nature immunology 14, 514–522. 10.1038/ni.2569. [DOI] [PMC free article] [PubMed] [Google Scholar]
- 14.Mohib K., Cherukuri A., Yu Z., Ding Q., Watkins S., and Rothstein D. (2020). Antigen-dependent interactions between regulatory B cells and T cells at the T:B border inhibit subsequent T cell interactions with DCs. Am J Transplant 20, 52–63. [DOI] [PMC free article] [PubMed] [Google Scholar]
- 15.Fillatreau S., Sweenie C.H., McGeachy M.J., Gray D., and Anderton S.M. (2002). B cells regulate autoimmunity by provision of IL-10. Nat Immunol 3, 944–950. 10.1038/ni833 [pii]. [DOI] [PubMed] [Google Scholar]
- 16.Abou-Daya K.I., Tieu R., Zhao D., Rammal R., Sacirbegovic F., Williams A.L., Shlomchik W.D., Oberbarnscheidt M.H., and Lakkis F.G. (2021). Resident memory T cells form during persistent antigen exposure leading to allograft rejection. Sci Immunol 6. 10.1126/sciimmunol.abc8122. [DOI] [PMC free article] [PubMed] [Google Scholar]
- 17.Lin C.C., Bradstreet T.R., Schwarzkopf E.A., Sim J., Carrero J.A., Chou C., Cook L.E., Egawa T., Taneja R., Murphy T.L., et al. (2014). Bhlhe40 controls cytokine production by T cells and is essential for pathogenicity in autoimmune neuroinflammation. Nat Commun 5, 3551. 10.1038/ncomms4551. [DOI] [PMC free article] [PubMed] [Google Scholar]
- 18.Wilson M.S., Cheever A.W., White S.D., Thompson R.W., and Wynn T.A. (2011). IL-10 blocks the development of resistance to re-infection with Schistosoma mansoni. PLoS Pathog 7, e1002171. 10.1371/journal.ppat.1002171. [DOI] [PMC free article] [PubMed] [Google Scholar]
- 19.Wang C., Yosef N., Gaublomme J., Wu C., Lee Y., Clish C.B., Kaminski J., Xiao S., Meyer Zu Horste G., Pawlak M., et al. (2015). CD5L/AIM Regulates Lipid Biosynthesis and Restrains Th17 Cell Pathogenicity. Cell 163, 1413–1427. 10.1016/j.cell.2015.10.068. [DOI] [PMC free article] [PubMed] [Google Scholar]
- 20.Akama-Garren E.H., van den Broek T., Simoni L., Castrillon C., van der Poel C.E., and Carroll M.C. (2021). Follicular T cells are clonally and transcriptionally distinct in B cell-driven mouse autoimmune disease. Nat Commun 12, 6687. 10.1038/s41467-021-27035-8. [DOI] [PMC free article] [PubMed] [Google Scholar]
- 21.Bettelli E., Carrier Y., Gao W., Korn T., Strom T.B., Oukka M., Weiner H.L., and Kuchroo V.K. (2006). Reciprocal developmental pathways for the generation of pathogenic effector TH17 and regulatory T cells. Nature 441, 235–238. 10.1038/nature04753. [DOI] [PubMed] [Google Scholar]
- 22.Lee Y., Awasthi A., Yosef N., Quintana F.J., Xiao S., Peters A., Wu C., Kleinewietfeld M., Kunder S., Hafler D.A., et al. (2012). Induction and molecular signature of pathogenic TH17 cells. Nat Immunol 13, 991–999. 10.1038/ni.2416. [DOI] [PMC free article] [PubMed] [Google Scholar]
- 23.Langrish C.L., Chen Y., Blumenschein W.M., Mattson J., Basham B., Sedgwick J.D., McClanahan T., Kastelein R.A., and Cua D.J. (2005). IL-23 drives a pathogenic T cell population that induces autoimmune inflammation. The Journal of experimental medicine 201, 233–240. 10.1084/jem.20041257. [DOI] [PMC free article] [PubMed] [Google Scholar]
- 24.Thakore P., Schnell A., Zhao M., Huang L., Hou Y., Christian E., Zaghouani S., Wang C., Singh V., Ma S., et al. (2022). The chromatin landscape of Th17 cells reveals mechanisms of diversification of regulatory and pro-inflammatory states. bioRxiv 2022.02.26.482041;. 10.1101/2022.02.26.482041. [DOI] [Google Scholar]
- 25.Yoo S.A., Kim M., Kang M.C., Kong J.S., Kim K.M., Lee S., Hong B.K., Jeong G.H., Lee J., Shin M.G., et al. (2019). Placental growth factor regulates the generation of T(H)17 cells to link angiogenesis with autoimmunity. Nat Immunol 20, 1348–1359. 10.1038/s41590-019-0456-4. [DOI] [PubMed] [Google Scholar]
- 26.Shimada K., Porritt R.A., Markman J.L., O’Rourke J.G., Wakita D., Noval Rivas M., Ogawa C., Kozhaya L., Martins G.A., Unutmaz D., et al. (2018). T-Cell-Intrinsic Receptor Interacting Protein 2 Regulates Pathogenic T Helper 17 Cell Differentiation. Immunity 49, 873–885 e877. 10.1016/j.immuni.2018.08.022. [DOI] [PMC free article] [PubMed] [Google Scholar]
- 27.Wu B., Zhang S., Guo Z., Wang G., Zhang G., Xie L., Lou J., Chen X., Wu D., Bergmeier W., et al. (2018). RAS P21 Protein Activator 3 (RASA3) Specifically Promotes Pathogenic T Helper 17 Cell Generation by Repressing T-Helper-2-Cell-Biased Programs. Immunity 49, 886–898 e885. 10.1016/j.immuni.2018.09.004. [DOI] [PMC free article] [PubMed] [Google Scholar]
- 28.Gaublomme J.T., Yosef N., Lee Y., Gertner R.S., Yang L.V., Wu C., Pandolfi P.P., Mak T., Satija R., Shalek A.K., et al. (2015). Single-Cell Genomics Unveils Critical Regulators of Th17 Cell Pathogenicity. Cell 163, 1400–1412. 10.1016/j.cell.2015.11.009. [DOI] [PMC free article] [PubMed] [Google Scholar]
- 29.Edwards J.C., Szczepanski L., Szechinski J., Filipowicz-Sosnowska A., Emery P., Close D.R., Stevens R.M., and Shaw T. (2004). Efficacy of B-cell-targeted therapy with rituximab in patients with rheumatoid arthritis. The New England journal of medicine 350, 2572–2581. 10.1056/NEJMoa032534. [DOI] [PubMed] [Google Scholar]
- 30.Hauser S.L., Waubant E., Arnold D.L., Vollmer T., Antel J., Fox R.J., Bar-Or A., Panzara M., Sarkar N., Agarwal S., et al. (2008). B-cell depletion with rituximab in relapsing-remitting multiple sclerosis. The New England journal of medicine 358, 676–688. 10.1056/NEJMoa0706383. [DOI] [PubMed] [Google Scholar]
- 31.Cross A.H., Stark J.L., Lauber J., Ramsbottom M.J., and Lyons J.A. (2006). Rituximab reduces B cells and T cells in cerebrospinal fluid of multiple sclerosis patients. J Neuroimmunol 180, 63–70. 10.1016/j.jneuroim.2006.06.029. [DOI] [PMC free article] [PubMed] [Google Scholar]
- 32.Li R., Rezk A., Miyazaki Y., Hilgenberg E., Touil H., Shen P., Moore C.S., Michel L., Althekair F., Rajasekharan S., et al. (2015). Proinflammatory GM-CSF-producing B cells in multiple sclerosis and B cell depletion therapy. Sci Transl Med 7, 310ra166. 10.1126/scitranslmed.aab4176. [DOI] [PubMed] [Google Scholar]
- 33.Bar-Or A., Fawaz L., Fan B., Darlington P.J., Rieger A., Ghorayeb C., Calabresi P.A., Waubant E., Hauser S.L., Zhang J., and Smith C.H. (2010). Abnormal B-cell cytokine responses a trigger of T-cell-mediated disease in MS? Ann Neurol 67, 452–461. 10.1002/ana.21939. [DOI] [PubMed] [Google Scholar]
- 34.Clatworthy M.R., Watson C.J., Plotnek G., Bardsley V., Chaudhry A.N., Bradley J.A., and Smith K.G. (2009). B-cell-depleting induction therapy and acute cellular rejection. The New England journal of medicine 360, 2683–2685. 10.1056/NEJMc0808481. [DOI] [PMC free article] [PubMed] [Google Scholar]
- 35.Starling R.C., Armstrong B., Bridges N.D., Eisen H., Givertz M.M., Kfoury A.G., Kobashigawa J., Ikle D., Morrison Y., Pinney S., et al. (2019). Accelerated Allograft Vasculopathy With Rituximab After Cardiac Transplantation. J Am Coll Cardiol 74, 36–51. 10.1016/j.jacc.2019.04.056. [DOI] [PubMed] [Google Scholar]
- 36.Stockinger B., and Omenetti S. (2017). The dichotomous nature of T helper 17 cells. Nature reviews. Immunology 17, 535–544. 10.1038/nri.2017.50. [DOI] [PubMed] [Google Scholar]
- 37.Pawlak M., Ho A.W., and Kuchroo V.K. (2020). Cytokines and transcription factors in the differentiation of CD4(+) T helper cell subsets and induction of tissue inflammation and autoimmunity. Current opinion in immunology 67, 57–67. 10.1016/j.coi.2020.09.001. [DOI] [PMC free article] [PubMed] [Google Scholar]
- 38.Codarri L., Gyulveszi G., Tosevski V., Hesske L., Fontana A., Magnenat L., Suter T., and Becher B. (2011). RORgammat drives production of the cytokine GM-CSF in helper T cells, which is essential for the effector phase of autoimmune neuroinflammation. Nat Immunol 12, 560–567. 10.1038/ni.2027. [DOI] [PubMed] [Google Scholar]
- 39.Meyer Zu Horste G., Wu C., Wang C., Cong L., Pawlak M., Lee Y., Elyaman W., Xiao S., Regev A., and Kuchroo V.K. (2016). RBPJ Controls Development of Pathogenic Th17 Cells by Regulating IL-23 Receptor Expression. Cell Rep 16, 392–404. 10.1016/j.celrep.2016.05.088. [DOI] [PMC free article] [PubMed] [Google Scholar]
- 40.Schraml B.U., Hildner K., Ise W., Lee W.L., Smith W.A., Solomon B., Sahota G., Sim J., Mukasa R., Cemerski S., et al. (2009). The AP-1 transcription factor Batf controls T(H)17 differentiation. Nature 460, 405–409. 10.1038/nature08114. [DOI] [PMC free article] [PubMed] [Google Scholar]
- 41.Bod L., Kye Y.-C., Shi J., Triglia E., Schnell A., Fessler J., Ostrowski S., Von-Franque M., Kuchroo J., Barilla R., et al. (2023). Single-cell profiling identifies B-cell specific checkpoint molecules that regulate antitumor immunity. Nature In Press. [DOI] [PMC free article] [PubMed] [Google Scholar]
- 42.Khalil A.M., Cambier J.C., and Shlomchik M.J. (2012). B cell receptor signal transduction in the GC is short-circuited by high phosphatase activity. Science 336, 1178–1181. 10.1126/science.1213368. [DOI] [PMC free article] [PubMed] [Google Scholar]
- 43.Benjamini Y., and Hochberg Y. (1995). Controlling the False Discovery Rate: A Practical and Powerful Approach to Multiple Testing. Journal of the Royal Statistical Society. Series B (Methodological) 57, 289–300. [Google Scholar]
- 44.Gu Z., Eils R., and Schlesner M. (2016). Complex heatmaps reveal patterns and correlations in multidimensional genomic data. Bioinformatics 32, 2847–2849. 10.1093/bioinformatics/btw313. [DOI] [PubMed] [Google Scholar]
Associated Data
This section collects any data citations, data availability statements, or supplementary materials included in this article.