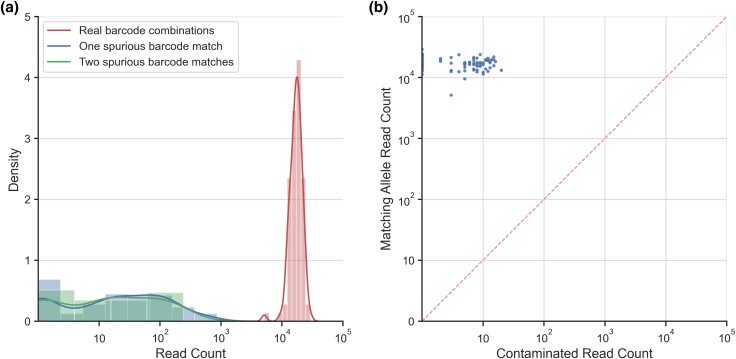
Fig. 5.
a) Histograms comparing the coverage of properly barcoded reads to that of reads with either one or two improper barcodes for 96 unique control sample barcode combinations. The distributions of one and two spurious barcode matches represent the relative risk of misbarcoding in a FREQ-Seq2 library. b) Coverage of reads containing a valid genotype (y-axis) versus the coverage of contaminated reads containing an unrecognized allele (x-axis) among properly barcoded control sample reads for each of the 96 barcode combinations. The dashed red line is a one-to-one scaled diagonal between the axes.

