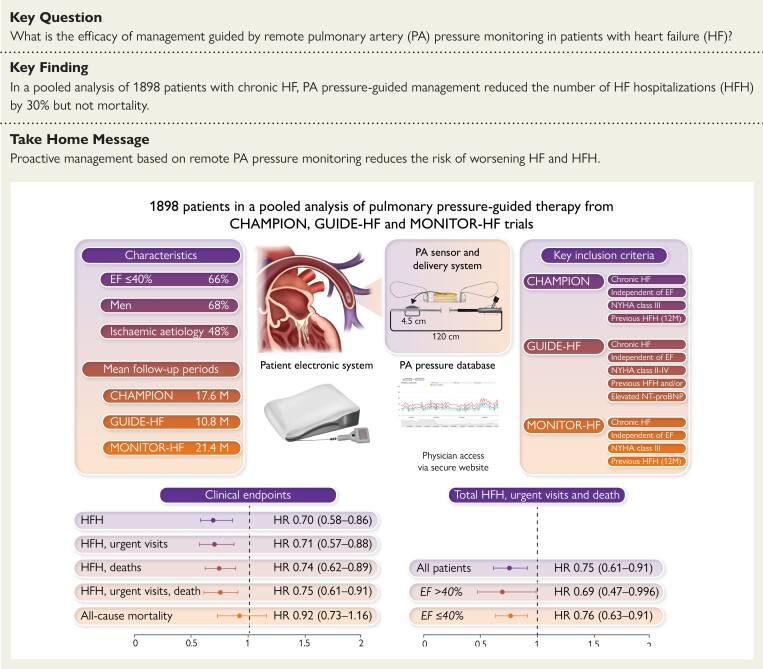
Structured Graphical Abstract.
The upper part of the figure shows the characteristics of the included RCTs at the sides, and the pulmonary artery sensor, patient electronics system, and the pulmonary artery pressure database in the middle. In the lower part of the figure, the x axis presents the risk ratio, the y axis presents the data points of clinical endpoints as addressed, the dot is the point estimate of the hazard ratio pooled estimate, and the bars correspond to the 95% confidence interval. CI, confidence interval; EF, ejection fraction; HR, hazard ratio; HF, heart failure; HFH, heart failure hospitalization; M, months; NT-proBNP, N-terminal pro-B-type natriuretic peptide; NYHA, New York Heart Association; PA, pulmonary artery.

