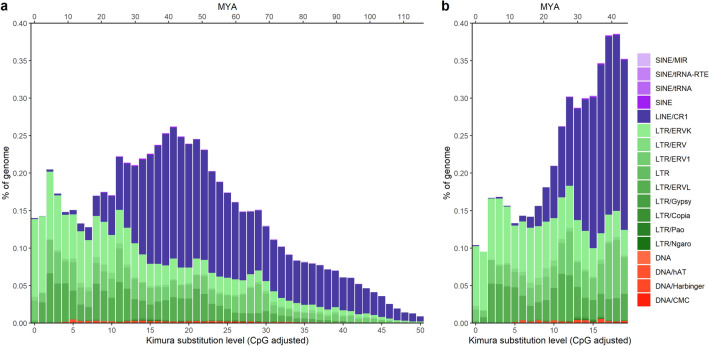
Figure 1.
Interspersed repeat landscape of the blackcap genome. (a) Repeat landscape calculated by RepeatMasker on the raw output. (b) Repeat landscape calculated on the final curated TE annotation (see Materials and Methods for more details). The bottom x-axis shows the kimura-2 substitution level (CpG adjusted), the top x-axis is the timescale in million years ago (MYA), and the y-axis is the percentage of the genome occupied. Colour coding of the different repeat types/families found is listed to the left.

