Figure 2.

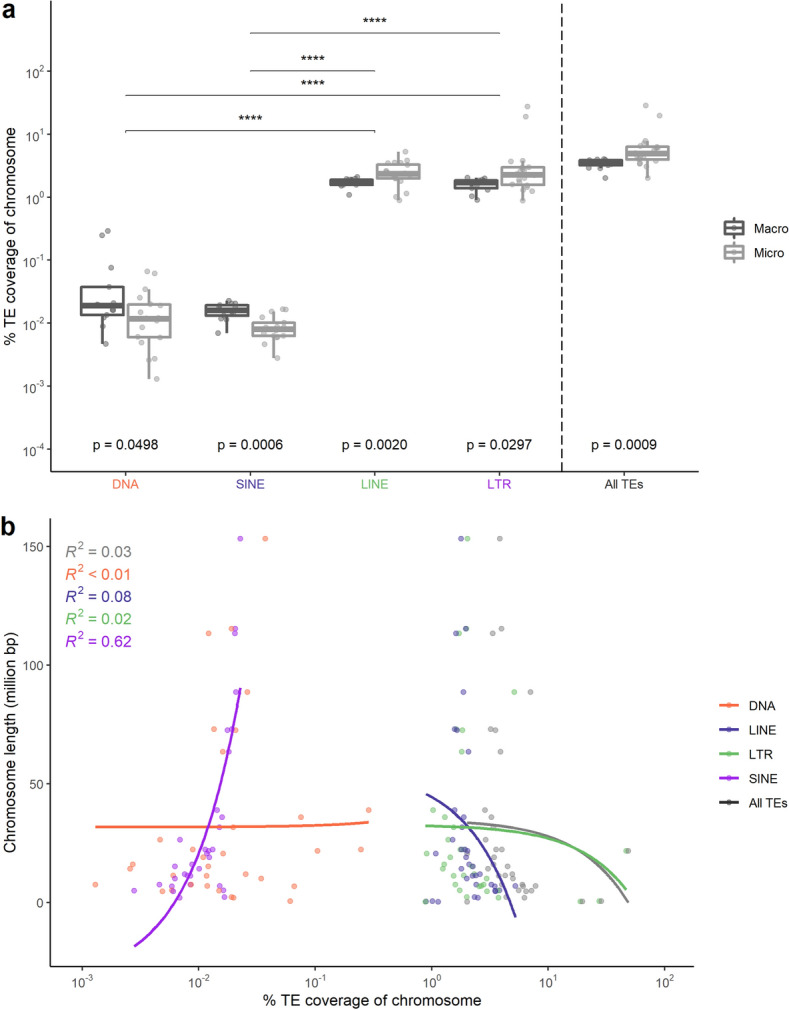
Relationships of the TEs and TE types to chromosomal characteristics. (a) Percentage of TE coverage for chromosomes separated based on macro and micro chromosomes. The coverage is presented for each TE type separately, and measures for all TEs together are shown to the left of the dotted line. P values are provided for Kruskal–Wallis tests comparing the means of micro and macro chromosomes (colour coded as in the legend) per type and for all TEs. Furthermore, significant comparisons were visualized with (*) (p ≤ 0.05 = *, p ≤ 0.01 = **, p ≤ 0.001 = *** and p ≤ 0.0001 = ****), of Kruskal–Wallis tests comparing the overall distributions of the different TE types and all TEs, all the significant p-values were < 2.22e-16. (b) Relative % TE coverage (log scale) of the chromosomes compared to chromosome length for all TEs (black) and per TE type separately (colour coded as in the legend). The only significant relationship between % relative TE coverage and chromosome length is observed for SINEs (p = 8.48e-8).
