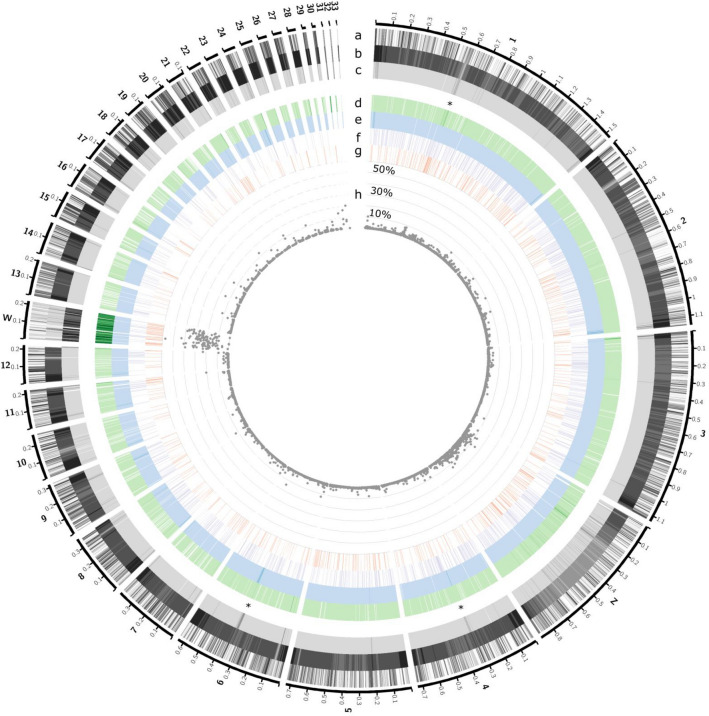
Figure 3.
Genome-wide visualisation of detected TEs. All visualised features are calculated within windows of 200 kb. The respective chromosome number is indicated on the outside of the circos diagram. (a) Gene coverage (0 (white)–100 (black) %), (b) recombination rate (the higher the recombination rate, the darker), log 10 adjusted. TEs covered a 200 kb window to a maximum of 80%, in mainly the W chromosome (due to reduced recombination in sex chromosomes). To aid in visualising the lower registers of this distribution we narrowed our range for the TE tracks between 0 and 80% (from light to dark). Overall TEs and the TE types are colour-coded following the previous figures. In descending order (c) overall TE coverage, (d) LTR (green), (e) LINE (blue), (f) SINE (purple) and (g) DNA (red). The innermost track (h) shows the distribution of TE coverage (in 200 kb windows) of recent TEs, from 0 to 60% as this was the range occupied. The y-axis of this track illustrates the percentage of genome covered in increments of 10% (10, 30 and 50% labelled), while * highlight regions in autosomes with high levels of TE coverage.

