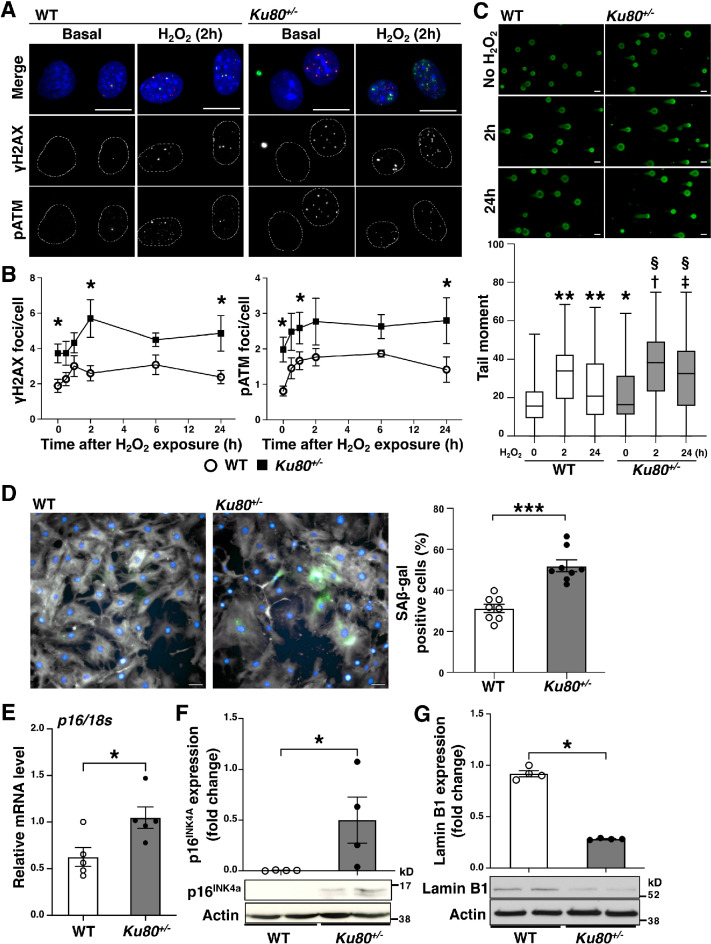
Figure 3.
Ku80-deficient vascular smooth muscle cells showed persistent DNA damage response and senescent characteristics. (A and B) Immunofluorescent analysis of DNA damage response in the wild type (WT) and Ku80+/− VSMCs. (A) Representative images of cells stained with anti-γH2AX antibody (in green) and anti-phosphorylated ataxia telangiectasia mutated (pATM) antibody (in red) indicating activation of the DNA damage response. Cells were counterstained with DAPI (in blue). Bar = 20 µm. (B) Time-course analysis of DSBs accumulation and activation of the DNA damage response. The cells were exposed to hydrogen peroxide (10 µM) for 30 min, 1, 2, 6, or 24 h (n = 7). At least one hundred cells were counted for γH2AX and pATM foci from each group. *p < 0.05. (C) Neutral comet assay of WT and Ku80+/− VSMCs exposed to hydrogen peroxide (50 µM) for 2 or 24 h. Representative images on the top. Quantification on the bottom. Error bars indicate the median and max/min of at least 373 cells for each group. *p < 0.05, **p < 0.0001 versus WT(no H2O2); † p < 0.0001 versus WT(2 h); ‡ p < 0.0001 versus WT(24 h); §p < 0.0001 versus Ku80+/− (no H2O2). Statistical significance was determined using one-way ANOVA. (D) Staining of senescence-associated β-gal (SA β-gal) in VSMCs. Representative images on the left (WT) and middle (Ku80+/−) panels (SA β-gal in green, Phalloidin in gray, DAPI in blue). Bar = 50 µm. Quantification of SA β-gal positive cells in percentages on the right panel (n = 8). ***p < 0.001. E) p16 mRNA level (a senescent marker) in cells was quantified by real-time qPCR analysis (n = 5). *p < 0.05. (F) Western blot analyses of p16INK4A and (G) lamin B1 in cells (n = 4). Bands are cropped from the original blots presented in Supplemental Figure 8. *p < 0.05. Statistical significance between groups was determined using the Mann–Whitney U test. Data are expressed as mean ± SEM.

