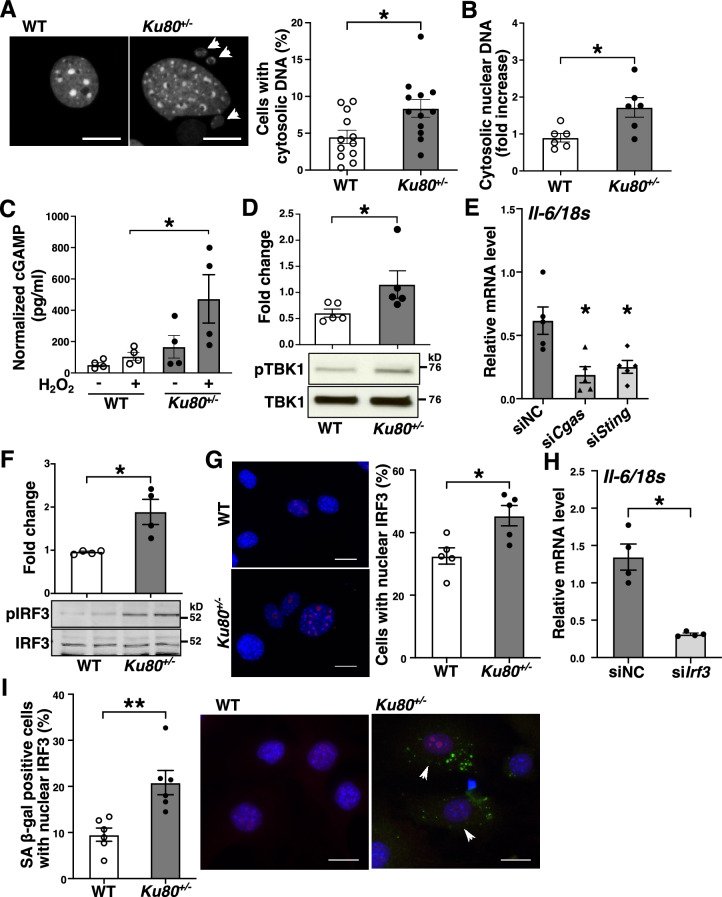
Figure 5.
cGAS-STING pathway was upregulated in Ku80-deficient cells. (A) VSMCs were stained with DAPI. The left panels are representative images of nuclei. The white arrowheads indicate cytosolic DNA. Bar = 20 µm. Quantification of cells with cytosolic DNA in percentage on the right panel (n = 12). *p < 0.05. (B) Cytosolic nuclear DNA in WT and Ku80+/− VSMCs was analyzed by real-time qPCR using primers for β2 microglobulin (n = 6). *p < 0.05. (C) ELISA assay of 2′3’-cGAMP concentration in cells at basal conditions or treated with hydrogen peroxide (100 µM) for 3 days (n = 4). (D) Western blot analyses of phosphorylated TBK1 (Ser172) in whole cell lysates (n = 5), (E) Cgas or Sting was silenced in Ku80+/− cells. IL-6 mRNA level was determined by real-time qPCR analysis. *p < 0.05 compared with negative control siRNA (siNC) (n = 5). (F) Western blot analysis of phosphorylated IRF3 (Ser396) in whole cell lysates (n = 4). (G) IRF3 nuclear translocation was detected by immunofluorescent staining. Representative images on the left panels. Bar = 20 µm. Quantification on the right panel (n = 5). H) IL-6 mRNA levels in Irf3-silenced Ku80+/− cells. *p < 0.05 compared with negative control siRNA (siNC) (n = 4). (I) Quantification of SA β-gal positive cells with nuclear IRF3 (n = 6). Representative images on the middle and right panels. SA β-gal stained in green; IRF3 in red; the nuclei in blue. Arrowheads indicate SA β-gal/nuclear IRF3-positive cells. Bar = 20 µm. **p < 0.01. Bands are cropped from the original blots presented in Supplemental Figure 10. Statistical significance between groups was determined using the Mann–Whitney U test. Data are expressed as mean ± SEM.

