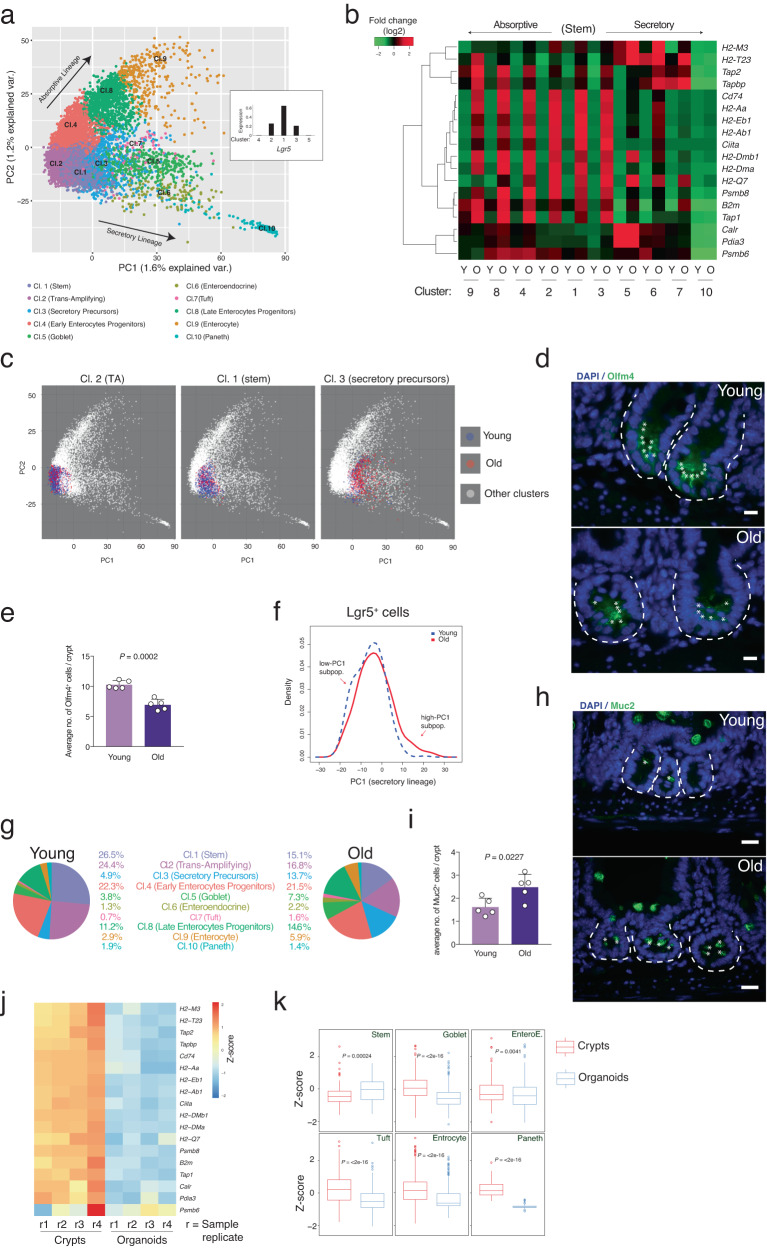
Fig. 3. Intestinal crypt cell composition changes during aging.
a Scatter plot of PC1 and PC2 values of the single cell RNA-seq (scRNA-seq) dataset (both the young and the old RNA-seq merged). Each cell is colored accordingly to its respective cluster (Cl.). Clusters are calculated by K-means. The small central panel represents the average of normalized read counts of the Lgr5 expression value in clusters 1–5. b Hierarchical clustering and heatmap of the expression level of the DEGs in the Antigen Presentation Pathway in the different clusters found in the scRNA-seq of young (Y) or old (O) mouse intestinal crypts. c Scatter plot of PC1 and PC2 values of the single cell RNA-seq (scRNA-seq) dataset (both the young and the old RNA-seq merged). Cells belonging to the indicated clusters are colored in blue (young-derived cells) or in red (old derived cells). d Representative pictures of anti-Olfm4 staining in young and aged proximal small intestine. Scale bar 20 µm. The dotted lines indicate the crypt structure. e The bar chart shows the average number of the Olfm4+ cells per crypts in the indicated groups. n = 5 mice per group were analyzed. Error bars represent the SD. P value was calculated by two-sided Welch’s t test. f Line-plot of the cell population density of the Lgr5-expressing cells (Lgr5+) along the PC1 axis measured by the scRNA-seq experiment. Old Lgr5+ cells show a shift in the PC1 profile with respect to the young ones. g Representative pie charts showing the percentage of cells belonging to each cluster in indicated ages. h Representative pictures of anti-Muc2 staining in the proximal small intestine of indicated ages. Scale bar 20 µm. The dotted lines indicate the crypt structure. i The bar chart shows the average number of the Muc2+ cells in the indicated ages. n = 5 mice per group were analyzed. Error bars represent the SD. P value was calculated by two-sided Welch’s t test. j Heatmap of the expression level (scaled by gene in the row) of the DEGs in the Antigen Presentation Pathway in 2 weeks cultured intestinal organoids. n = 4 mice per group. k Box plot of geneset enrichment analysis of the indicated gene datasets from each cluster as in j from in vivo proximal intestinal crypts and in vitro grown organoids. P value was calculated by two-sided Wilcoxon non-paired test.

