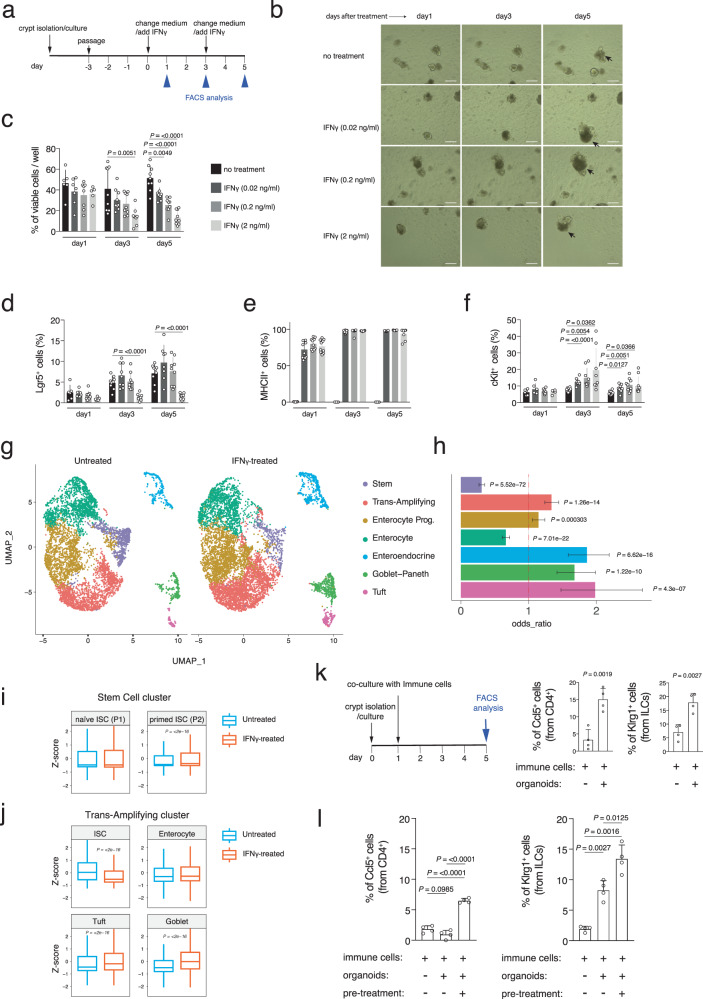
Fig. 5. IFNγ treatment of intestinal organoids mimics the intestinal crypt aging phenotype.
a Experimental scheme of IFNγ treatment of intestinal organoids. b Brightfield images of intestinal organoids that were treated with different concentration of IFNγ for 5 days. Non-treated cultures served as control. Apoptotic cells are indicated by arrow. Scale bar 200 µm. c–f Time-course analysis of organoids stimulated with different concentration of IFNγ for 5 days. Dissociated organoid cells were analyzed by FACS after cKit, MHCII, and DAPI staining. c viable cell percentage, d Lgr5+ cell percentage, e MHCII+ cell percentage, and f cKit+ cell percentage. Each dot represents one mouse. n = 9 mice per group were analyzed. Error bars represent the SD. P value was calculated by two-sided Welch’s t test. g UMAP projection of organoid culture derived EpCAM+ cells presenting seven different clusters, clustered via shared nearest neighbor modularity optimization-based clustering algorithm. Clusters were identified to epithelial cell types by using expressed markers. n 3 mice per group were analyzed. h Bar chart of odds ratio with 95% confidence interval showing the relative abundance of different epithelial cells changing after IFNγ treatment. P value was calculated by two-sided hypergeometric test. i, j Boxplots of geneset enrichment analyses of the indicated gene datasets in the in vitro treated intestinal organoids treated with 2 ng/ml IFNγ for 24 h. P value was calculated by two-sided Wilcoxon non-paired test. k The bar charts show the percentage of Ccl5+ CD4 Cytotoxic T cells (left panel) and Klrg1+ ILC2s (right panel) in the indicated conditions. Organoids were derived from old mice. n = 4 mice per group were analyzed. Error bars represent the SD. P value was calculated by two-sided Welch’s t test. l The bar charts show the percentage of Ccl5+ CD4 Cytotoxic T cells (left panel) and Klrg1+ ILC2s (right panel) in the indicated conditions. Organoids were derived from young mice. n = 4 mice per group were analyzed. Error bars represent the SD. P value was calculated by two-sided Welch’s t test.

