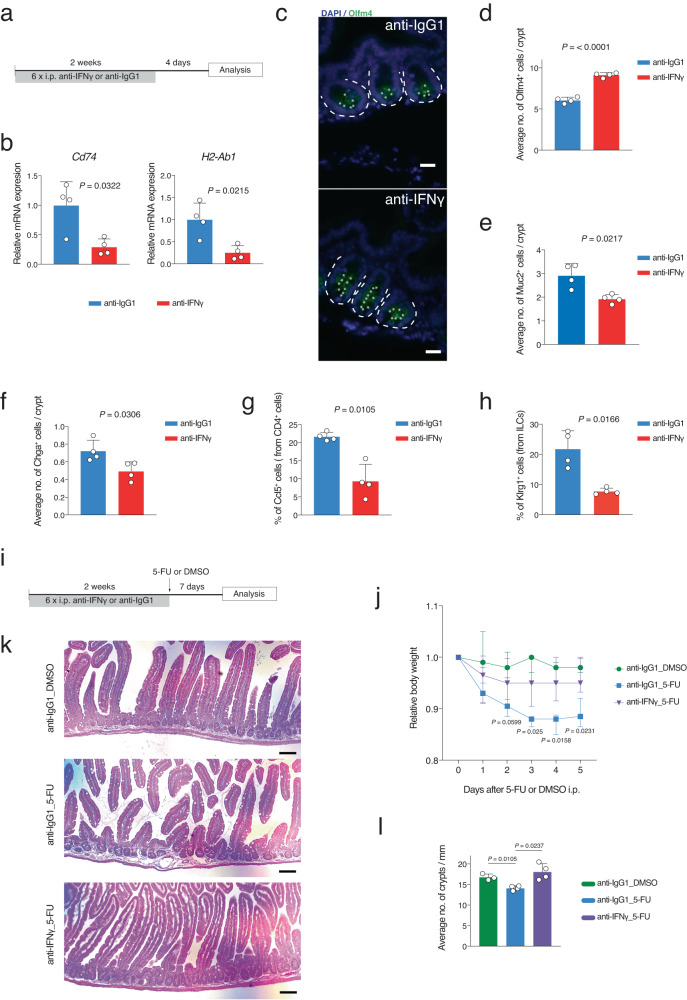
Fig. 6. In vivo IFNγ inhibition in aged mice rescues the aging-induced alteration in intestinal crypt cells.
a Schematic representation of IFNγ inhibition experiment. Anti-IFNγ antibody (25 mg/kg) was injected intraperitoneally (i.p.) for two weeks (3 injections per week) in old mice. Mice were sacrificed for organ harvest 4 days after the last injection. Anti-IgG1 antibody were used as control. b qRT-PCR validation of Cd74 and H2-Ab1 gene expression levels in indicated conditions. n = 4 mice per group were analyzed. Error bars represent the SD. P value was calculated by two-sided Welch’s t test. c Representative pictures of anti-Olfm4 staining in indicated conditions. Scale bar, 20 µm. The dotted lines indicate the crypt structure. d–f The bar charts show the immunofluorescence quantification of the Olfm4+, Muc2+, and Chga+ cells in the indicated conditions. n = 4 mice per group were analyzed. Error bars represent the SD. P value was calculated by two-sided Welch’s t test. g, h The bar charts show the percentage of Ccl5+ CD4 T (cytotoxic) and Klrg1+ ILC2 cells quantified by FACS analysis in the indicated conditions. n = 4 mice per group were analyzed. Error bars represent the SD. P value was calculated by two-sided Welch’s t test. i Schematic representation of the in vivo IFNγ inhibition experiment for regeneration analysis. Anti-IFNγ antibody (25 mg/kg) was injected intraperitoneally (i.p.) every second day. 3 injections per week for 2 weeks were performed. One day after the last injection, 5-fluorouracil (5FU; 150 mg/kg) or DMSO as control were intraperitoneally (i.p.) injected. j Body weights of treated old animals shown as mean ± SD. n = 4 mice per group were analyzed. P value was calculated by two-sided Welch’s t test. k Representative picture of H&E-stained longitudinal sections of the proximal part of the intestine from indicated conditions. Scale bars 100 µm. l The bar chart shows the average number of crypts per millimeter of the proximal part of the small intestine of the indicated groups. n = 4 mice per group were analyzed. Error bars represent the SD. P value was calculated by two-sided Welch’s t test.

