Figure 3.
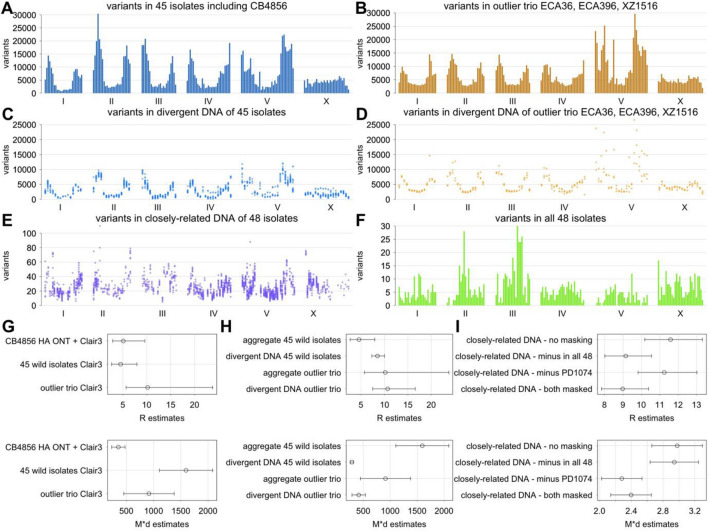
Analysis of variant abundance. (A-F) Number of variants in ~ 0.6 Mb intervals across six chromosomes are shown. (A-B) Total number of variants in aggregate (A) for 45 wild isolates without the outlier trio and (B) for the outlier trio of ECA36, ECA396, and XZ1516. (C-D) Mean number of variants in groups of divergent DNA (C) among the 45 isolates and (D) among the outlier trio. (E) Number of variants in closely-related DNA among all 48 isolates. (F) Number of variants that are present in all 48 isolates. (G-I) R (top) and (bottom) estimates and 95% confidence intervals are shown for different variant data sets. (G) Estimates using CB4856 HA with ONT data in addition to Illumina data, the 45 isolates in aggregate, and the outlier trio in aggregate. (H) Estimates using the 45 isolates and the outlier trio in aggregate and using divergent DNA within these groups. (I) Estimates using closely-related DNA in the 48 isolates without masking, with masking of variants that are present in all 48 isolates, with masking of variants that are present in PD1074, and with masking of both. Unless indicated otherwise, all analysis is of variants called by Clair3 using Illumina data.

