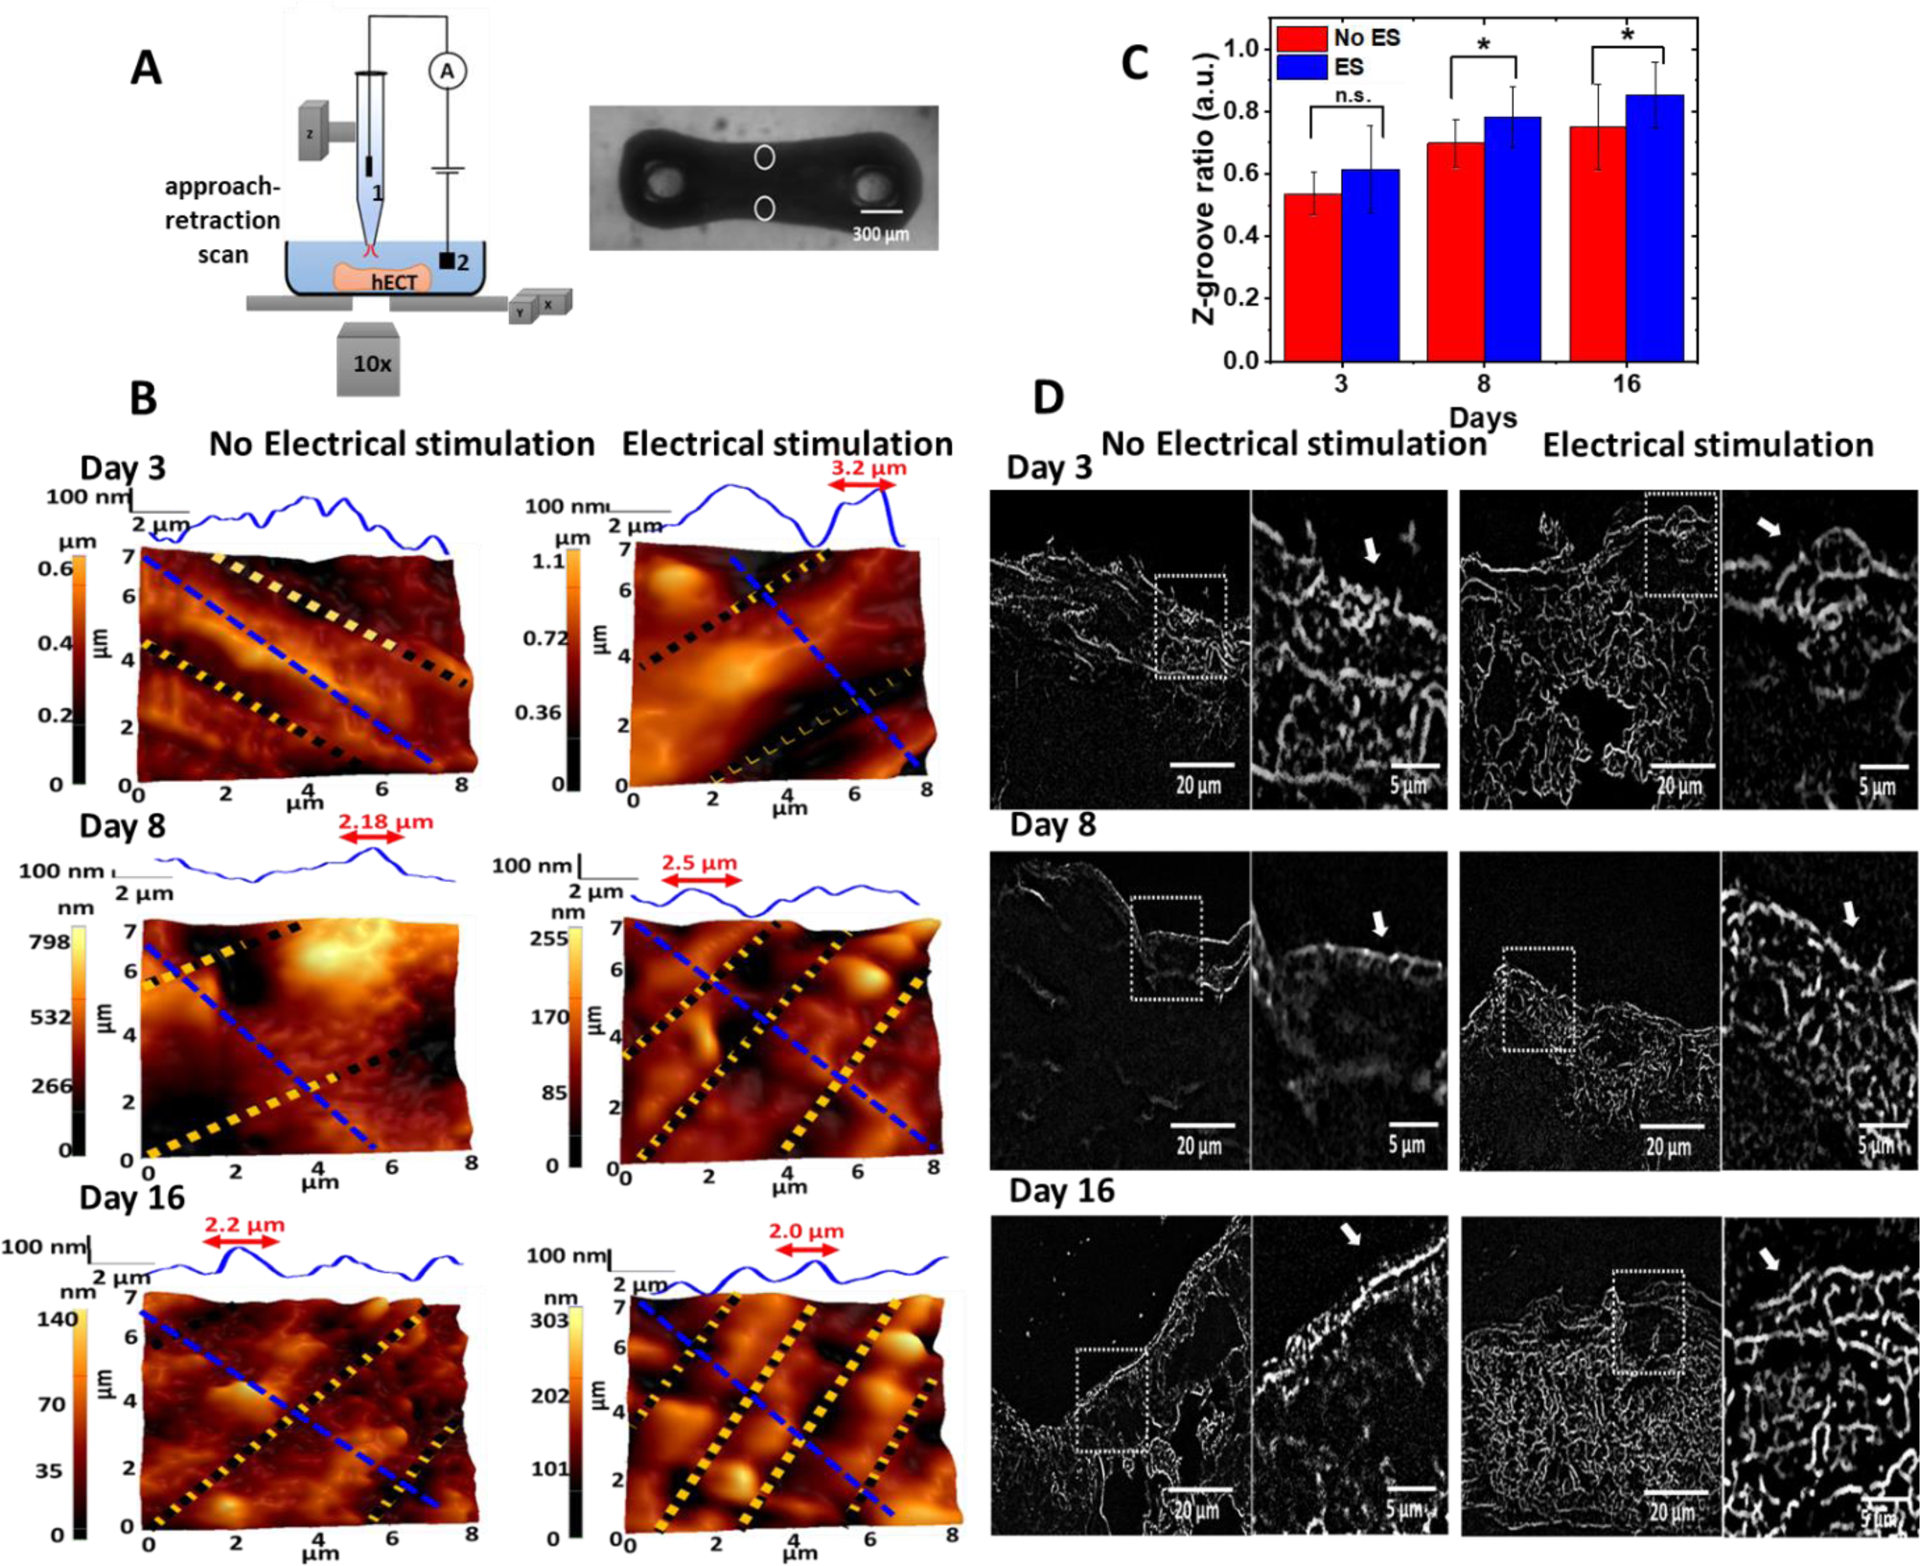
Figure 3. SICM topography images of the hECTs.

(A) Illustration of the SICM setup on acquiring the topography images from the edges of the hECT indicated by the white circles in the optical image of the hECT. The nanopipette is mounted on a Z-piezo actuator. The ion current that flows through the Ag/AgCl electrodes 1 and 2 is used as the feedback signal to control the distance between the nanopipette tip and the tissue membrane. (B) Topography images of the membrane surface on the edges of the hECTs at different culture days without and with ES. Height profiles are through the blue dashed lines marked in the topography images. Z-grooves are indicated by the yellow and black dotted lines that are used to estimate the Z-groove ratio. (C) Statistical analysis of the Z-groove ratio for the hECTs without and with ES. The ANOVA test confirmed significant differences in the Z-groove ratio (N=3,with 4–5 repeats). (D) Representative transversesectioned slices stained with WGA in hECTs at different culture time with and without ES. White arrows in the zoom-in images indicate the formation of the t-tubule network.
