Fig. 1.

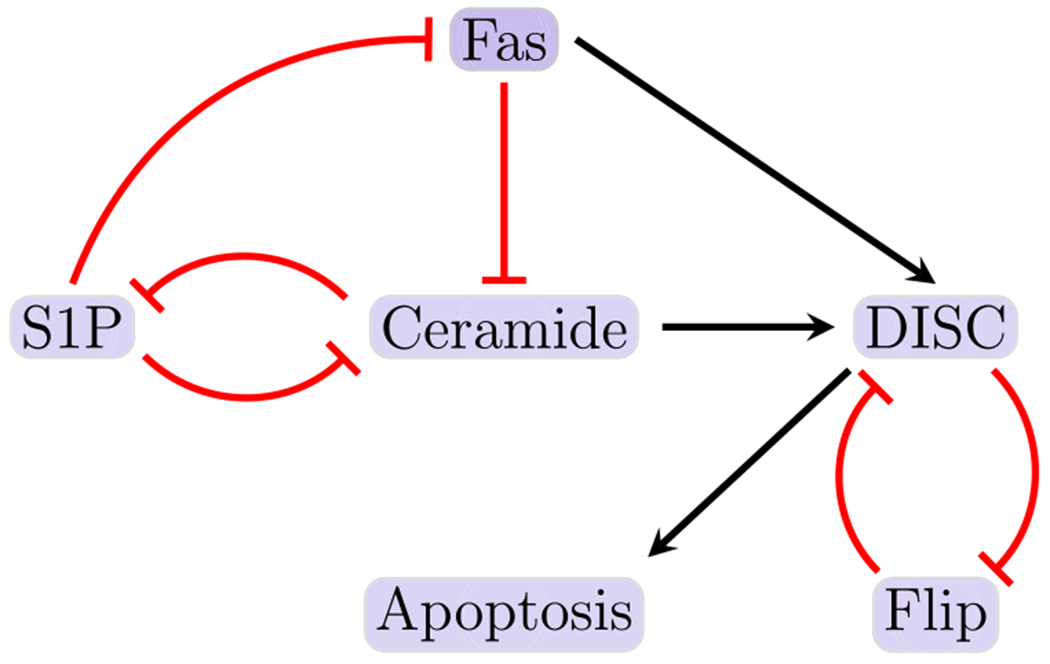
Reduced T-LGL network. The figure shown here indicates the smaller (reduced) T-LGL model, where black barbed arrows indicate signal expression and while red bar arrows indicate suppression (Plaugher 2022) (Color figure online)

Reduced T-LGL network. The figure shown here indicates the smaller (reduced) T-LGL model, where black barbed arrows indicate signal expression and while red bar arrows indicate suppression (Plaugher 2022) (Color figure online)