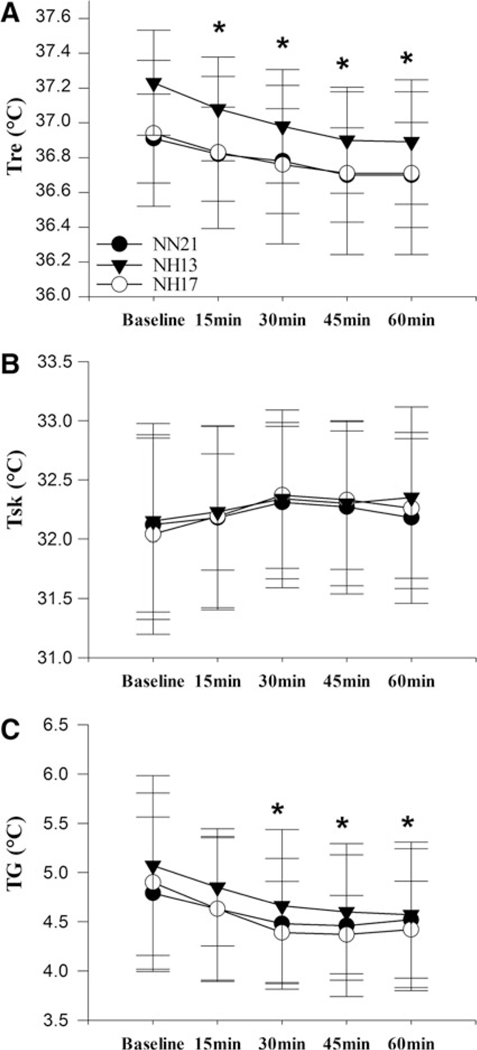
FIG. 1. (A).
Rectal temperature and (B) mean skin temperature and (C) thermal gradient between Tre and Tsk response to 60 minutes of resting in NN21, NH17, and NH13 conditions; *p≤0.05 compared with baseline at given time point, mean±SD. No significant condition by time interaction between the conditions. NH, normobaric hypoxia; NN, normobaric normoxia; SD, standard deviation; Tre, rectal temperature; Tsk, skin temperature.

