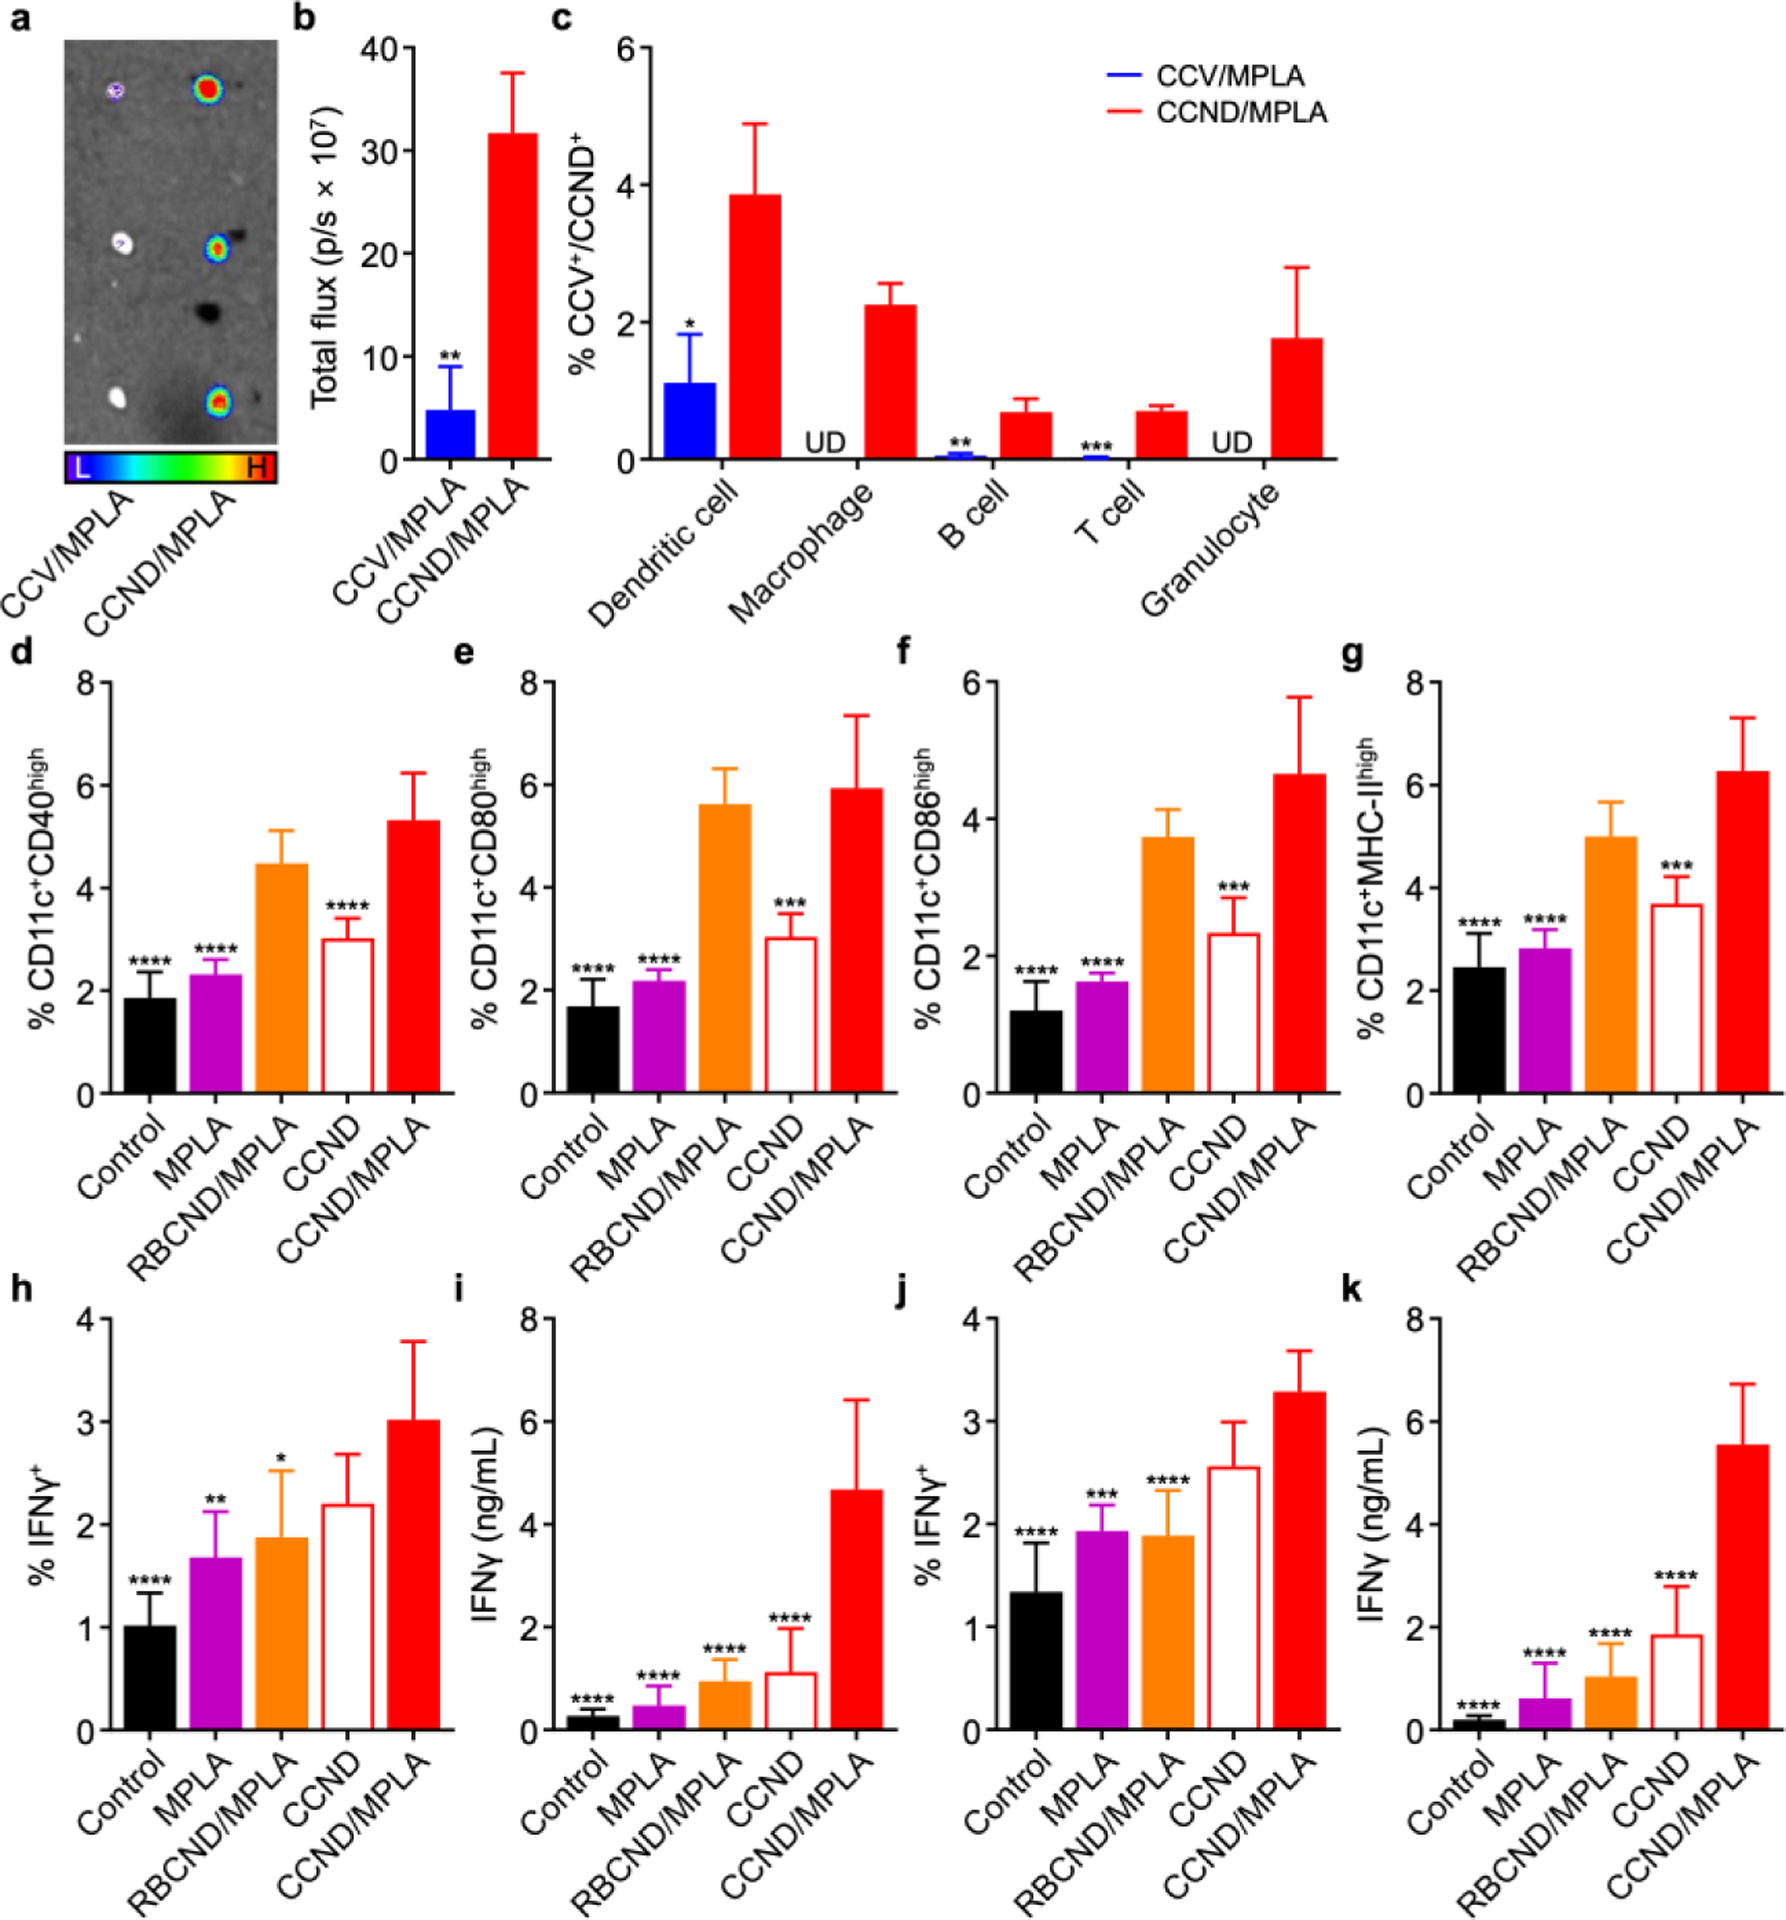
Figure 3.

In vivo transport and immune stimulation. (a) Ex vivo fluorescent imaging of the draining PLN at 24 h after the administration of dye-labeled CCV/MPLA and CCND/MPLA (L: low signal, H: high signal). (b) Quantification of fluorescence in the PLN at 24 h after the administration of dye-labeled CCV/MPLA and CCND/MPLA (n = 3, mean + SD). (c) Percentage of dendritic cells, macrophages, B cells, T cells, or granulocytes in the PLN positive for uptake of dye-labeled CCV/MPLA or CCND/MPLA at 24 h after administration (UD: undetectable; n = 3, mean + SD). (d–g) Expression of the maturation markers CD40 (d), CD80 (e), CD86 (f), and MHC-II (g) on dendritic cells in the draining PLN at 2 days after vaccination with CCND/MPLA and various controls (n = 5, mean + SD). (h–k) Percentage of IFNγ+ cells in the CD8+ T cell population (h,j) and IFNγ secretion level (i,k) for splenocytes collected from mice on day 28 after immunization with CCND/MPLA and various controls on days 0 and 7, followed by restimulation with (h,i) MC38 lysate or (j,k) the Adpgk peptide (n = 5, mean + SD). *p < 0.05, **p < 0.01, ***p < 0.001, and ****p < 0.0001 (compared to CCND/MPLA); Student’s t-test for (b,c) and one-way ANOVA for (d–k).
