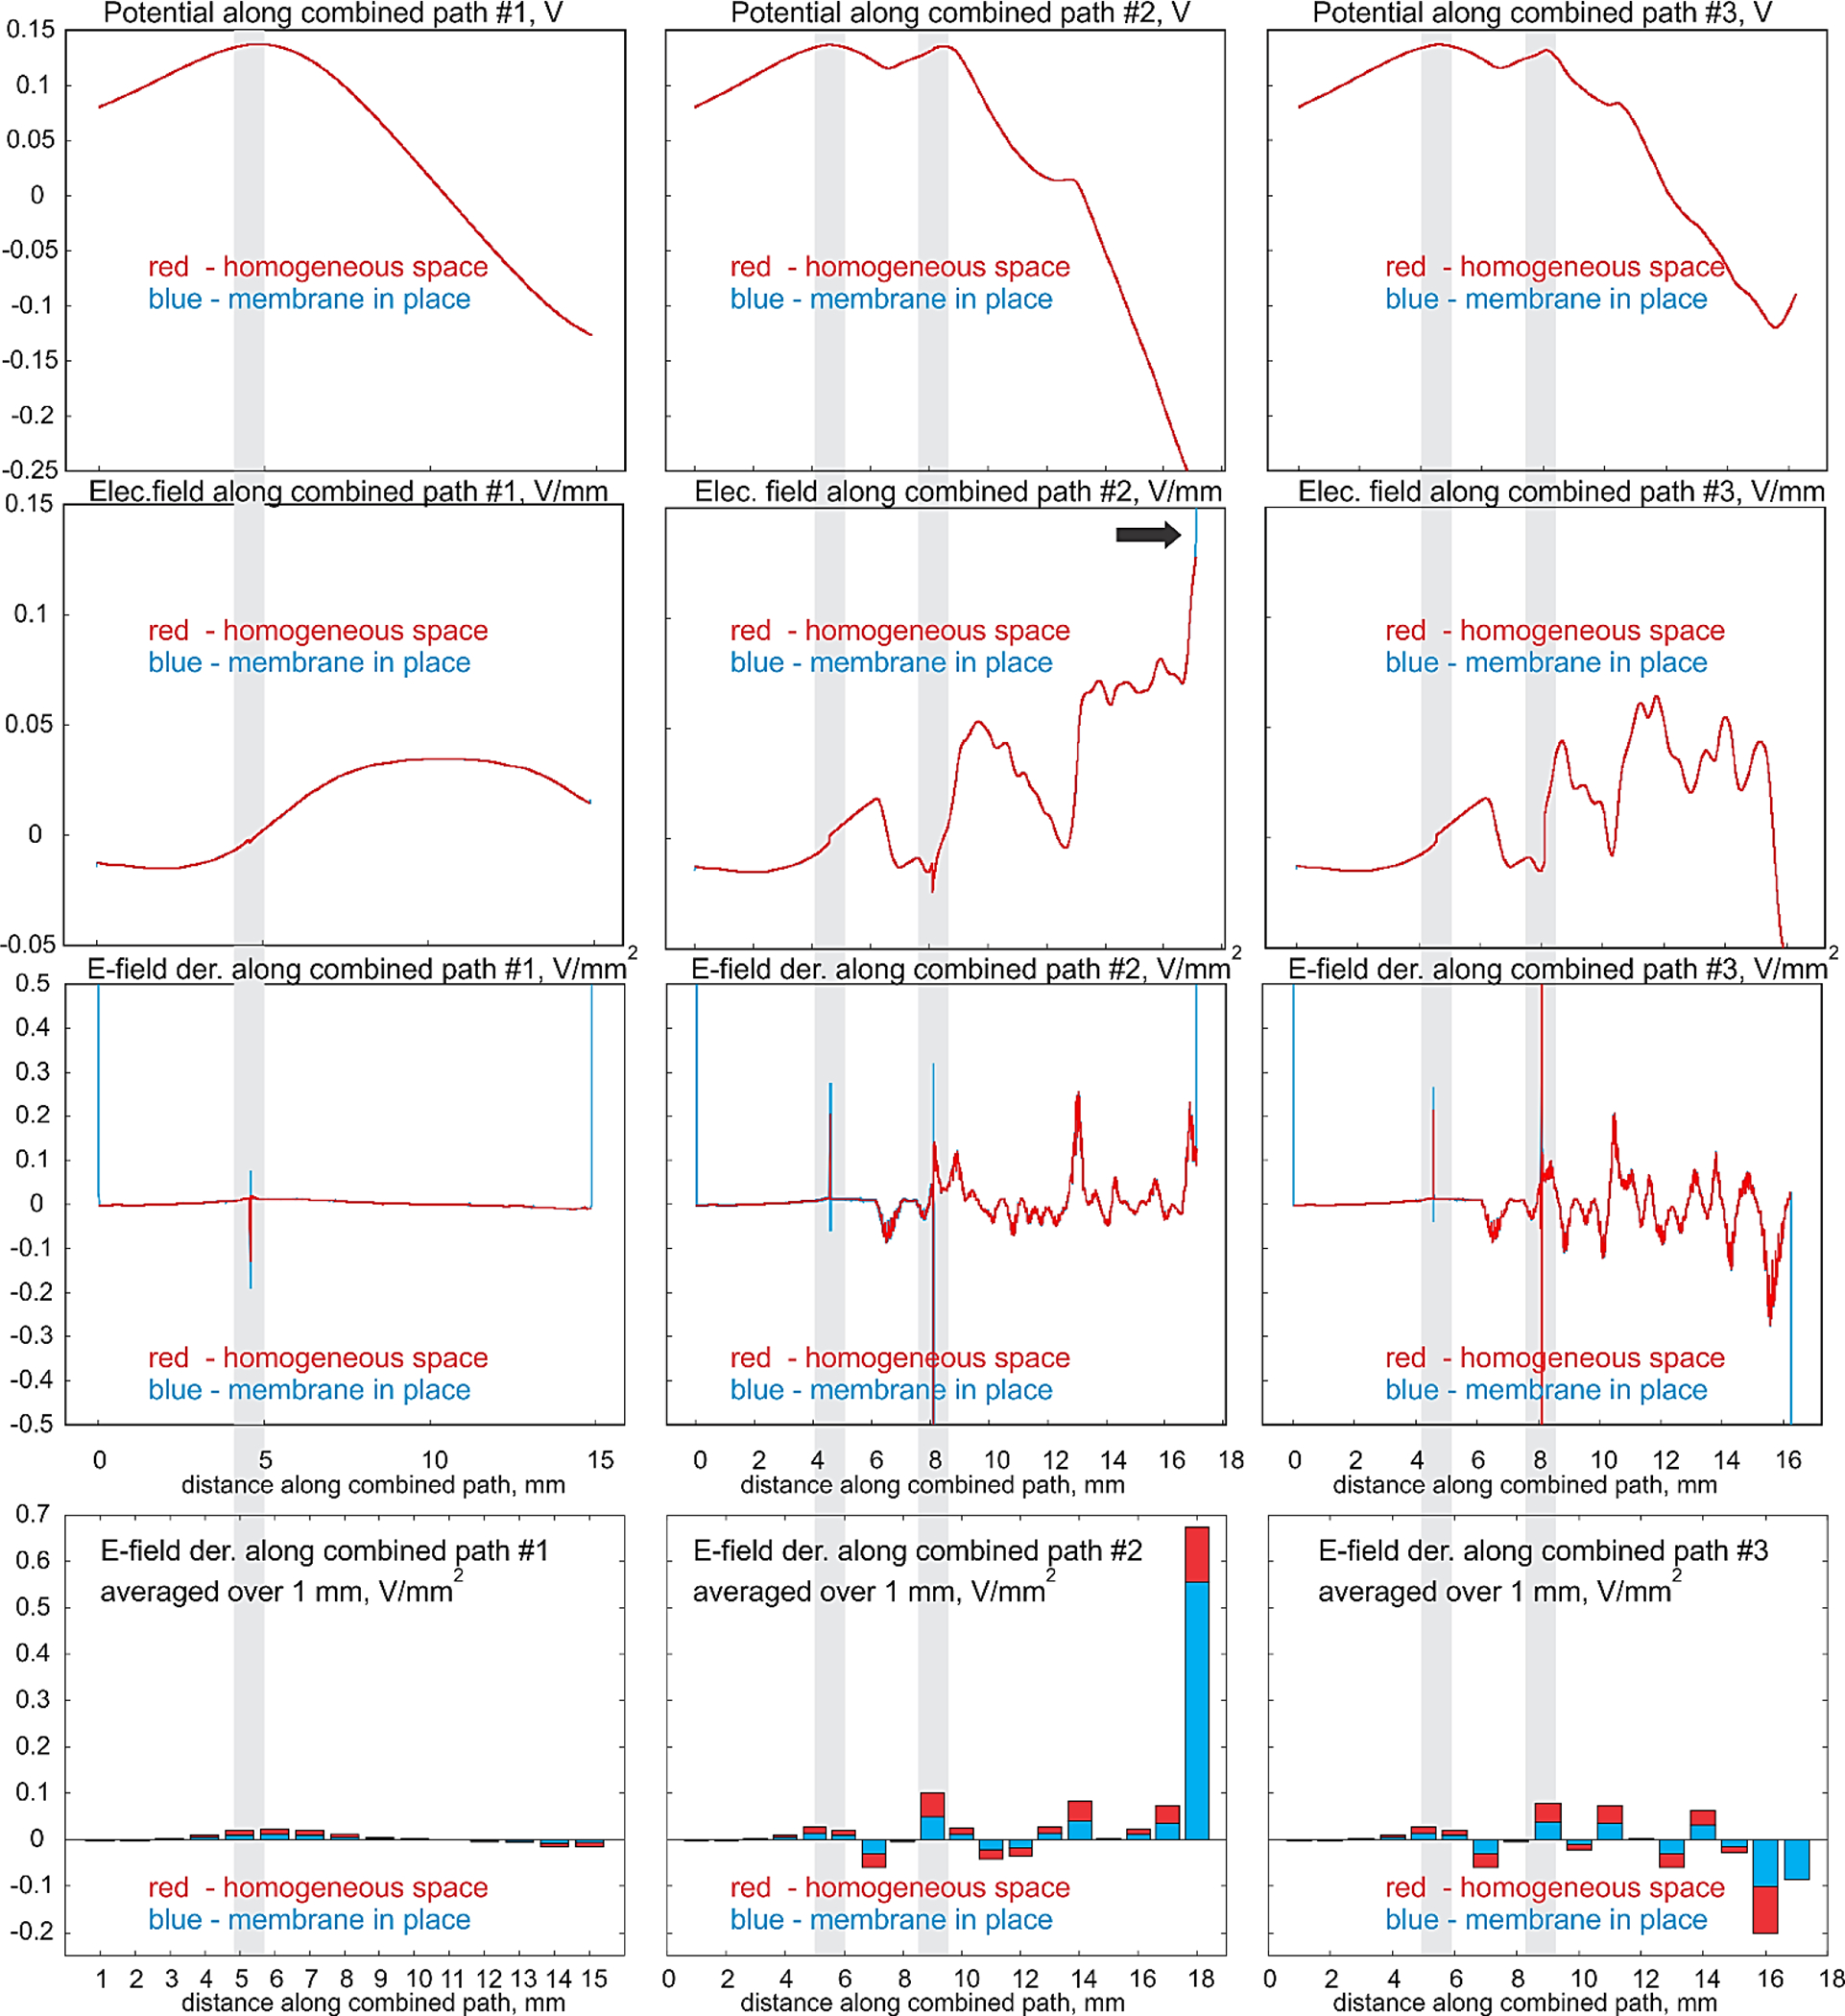
Fig. 7.

First row – electric potential (V); second row – collinear electric field (V/mm); third row – collinear field derivative along the path or (negative) activating function (V/mm2) for axon #1. Three columns correspond to the three continuous combined centerline paths from Fig. 4b,c. Red color – computations for the homogeneous space; blue color – computations with the membrane. The last row is the bar plot for the activating function averaged over a 1 mm centerline interval. Grey strips indicate bifurcation nodes; termination nodes are located at both ends of the curves.
