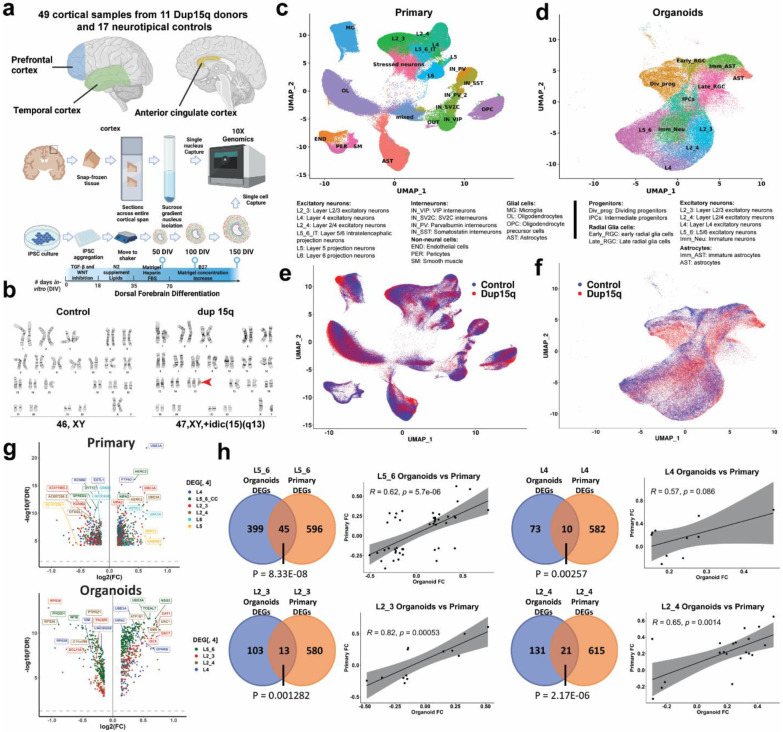
Figure 1. Comprehensive single-cell molecular profiling of dup15q syndrome using postmortem cortical samples and cortical organoids.
a) Illustration of experimental design, sample collection and cell capture. b) G-banding karyotype of normal and idic(15q) iPSC lines. c) Unbiased clustering of single nuclei and annotated cell types of postmortem samples. d) Unbiased clustering of cortical organoid single cells and annotated cell types. e) Primary nuclei clustered by genotype, showing equal contribution of dup15q and control samples to all cell types. f) Organoid cells clustered by genotype, showing similar contributions from dup15q and control organoids to all cell types. g) Volcano plots for cell type–specific genes differentially expressed in both primary and organoid excitatory neurons. h) Overlap between DEGs of primary and organoid excitatory neurons as well as Pearson’s correlation coefficient of shared genes fold changes.

