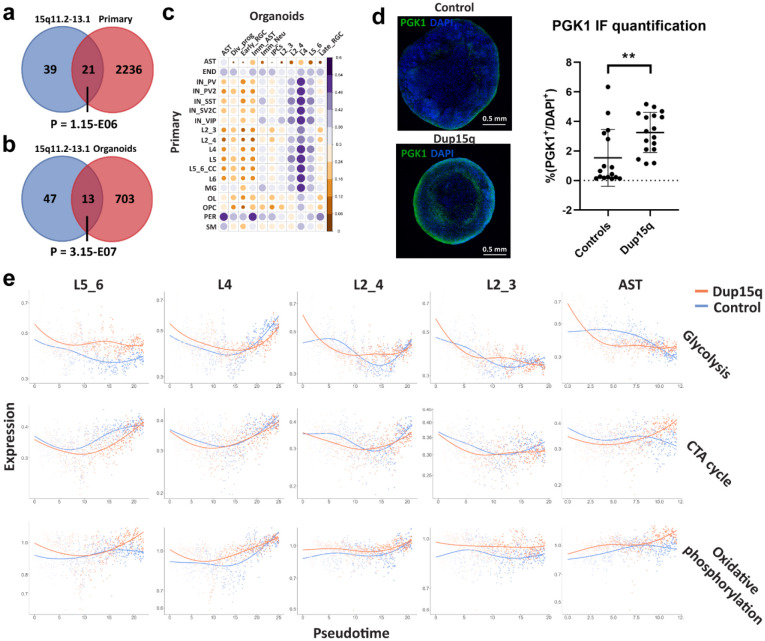
Extended Data Figure 5. Contribution of duplicated genes to DEGs, cell type gene expression correlation, and metabolic gene set expression of cell-specific trajectories along pseudotime.
a) Venn diagram showing overlap between putative duplicated genes and primary nuclei overexpressed genes from all cell types (P denotes a hypergeometric p value). b) Venn diagram showing overlap between putative duplicated genes and organoid overexpressed genes from all cell types (P denotes a hypergeometric p value). c) Pearson’s correlation plot of top 100 expressed genes between organoid and primary cell types. d) Immunofluorescent staining of the glycolysis enzyme PGK1 in control and dup15q organoids. The plot on the right is showing quantification summary of PGK1 expression. e) Metabolic gene set expression levels of organoid cell-specific trajectories plotted along pseudotime (red line denotes dup15q while blue lines denote control expression).

