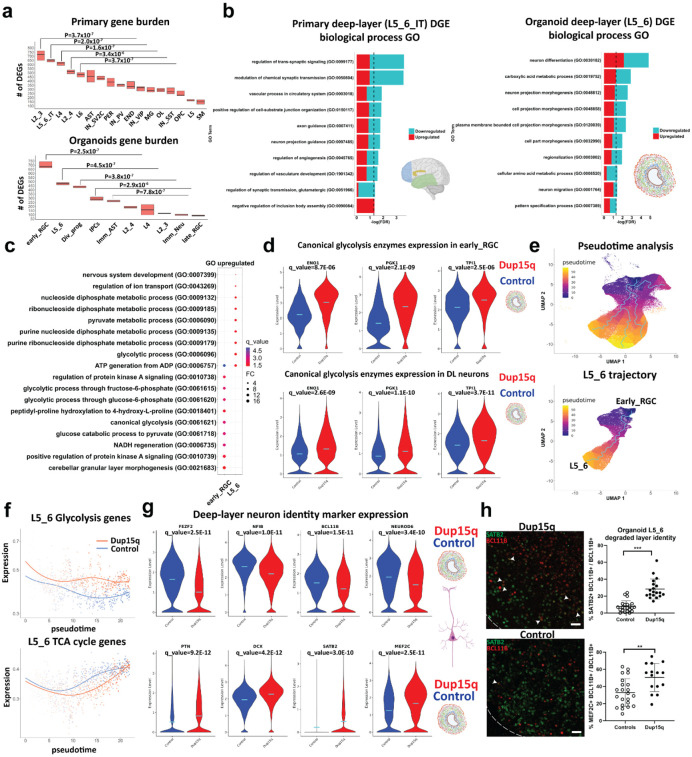
Figure 2. increased glycolysis in dup15q cortical organoids lead to degraded deep-layer neuronal identity.
a) Gene burden analysis of primary and cortical organoid cells-types. (Mann-Whitney U test). b) GO analysis of primary and cortical deep-layer (DL) excitatory neurons. c) GO analysis of organoid early RGC and DL neurons showing enrichment of glycolysis associated terms (q value = −log(FDR); FC = Fold change). d) Violin plots showing increased expression of canonical glycolytic enzymes in dup15q early RGCs and DL neurons. e) Pseudotime analysis identifies organoid trajectories comparable to in vivo cortical development (top panel). Identifying dynamic gene expression changes along the DL neuron trajectory (bottom panel). f) DL neurons of dup15q syndrome cortical organoids are expressing high levels of glycolysis genes and attenuated TCA cycle genes along pseudotime. g) Violin plots showing co-expression of DL markers, immature neuron markers, and UL neuron markers, indicating degraded identity of dup15q organoid DL neurons. (Control in blue and dup15q in red). f) IF and Co-expression analysis of organoid DL and UL neuron markers (scale bar = 100μm; white arrowheads indicating BLC11B and SATB2 co-expression).

